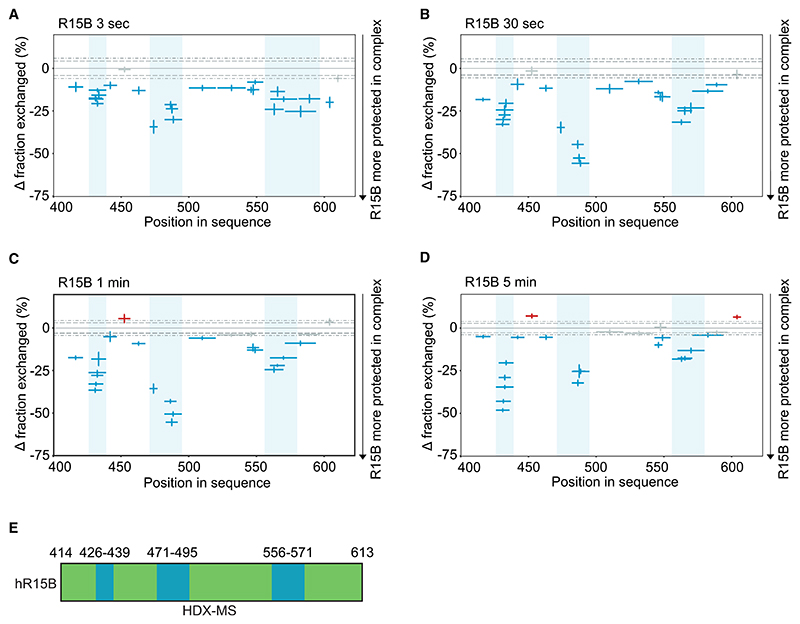
Figure 3. R15B binds eIF2 via discrete regions.
(A–D) Woods plots showing the difference indeuteration for a given R15B peptide at a given time point (A, 3 s; B, 30 s; C, 1 min; and D, 5 min) against the sequence position following addition of eIF2 complex. Deprotected, protected, and non-significantly different peptides are in red, blue, and gray, respectively, plotted as Δ fraction exchanged between the two states (y-axis). Bar length corresponds to peptide length plotted against the amino acid sequence (x-axis). Dashed and dotted lines indicate 98% and 99% confidence intervals applied to identify peptides with statistically significant deuteration differences. Regions with greatest differences are highlighted in blue. Error bars denote combined uncertainty of peptide deuteration calculated based on triplicate experiments.
(E) Cartoon representation of the three short regions of R15B414–613 protected from deuteration upon binding to eIF2. Green depicts the substrate-recruitment module of R15B identified in Figure 1, and blue depicts the regions most protected upon binding to eIF2.

