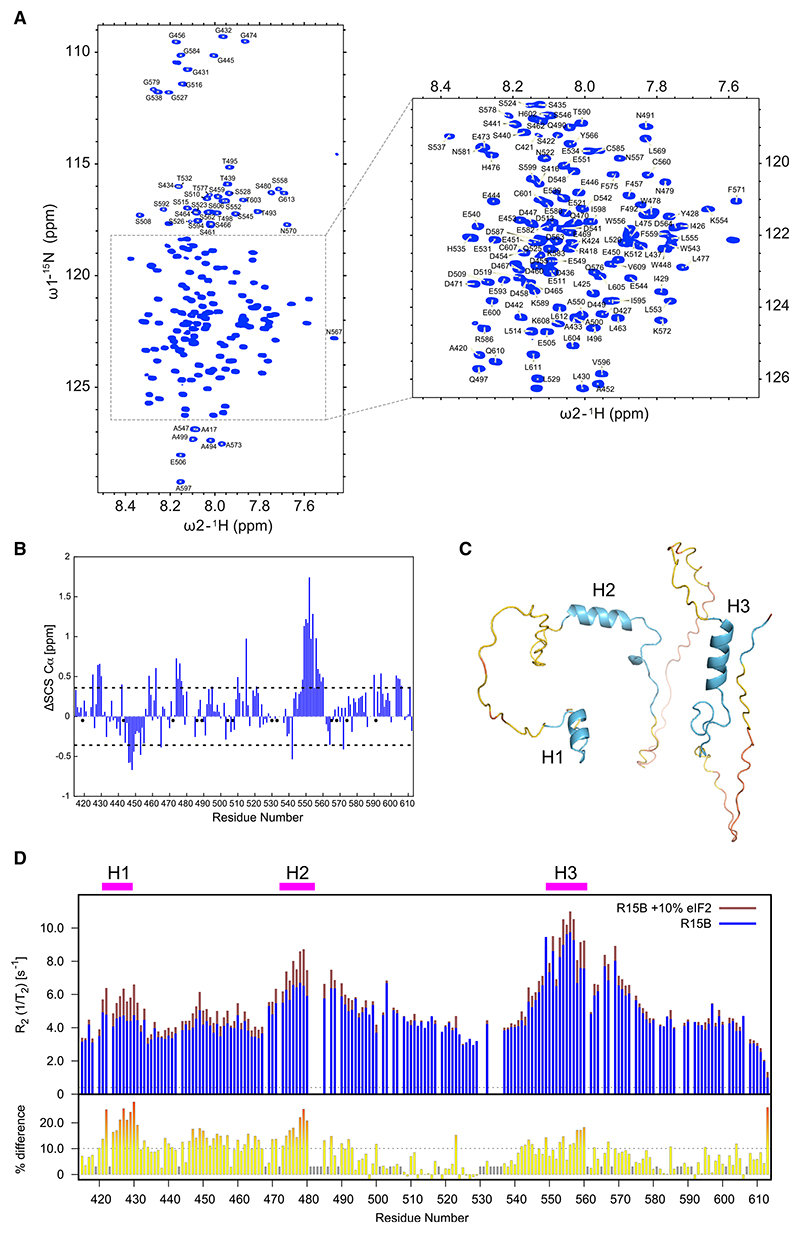
Figure 4. NMR reveals discrete helical elements of R15B that bind eIF2.
(A) 1H,15N 2D HSQC of R15B414–613 with assignment of backbone amide resonances. The inset shows an expanded view of the central region. The narrow dispersion of 1H chemical shifts is a hallmark of intrinsically disordered proteins.
(B) Secondary structure propensities of R15B414–613 characterized by the deviations of observed Cα chemical shifts from estimated random coil values (ΔSCS Cα). Negative values suggest a propensity for extended conformation, whereas positive deviations suggest increased likelihood of α-helical structure. Only consecutive stretches of residues with ΔSCS Cα values above or below 1 standard deviation are considered.
(C) AlphaFold2 model of R15B414–613. The residue positions of predicted helices are 424–429 (H1), 472–482 (H2), and 549–560 (H3). The model is colored based on the predicted local distance difference tests (pLDDTs). Blue color in the model corresponds to a confident score (90 > pLDDT > 70), yellow to a low confidence score (70 > pLDDT > 50), and orange to a very low confidence score (pLDDT < 50).
(D) Top panel: superposition of transverse relaxation R2 rates of R15B414–613 alone and in the presence of 10% eIF2.
Bottom panel: observed transverse relaxation R2 rate differences. Significant changes above 1 standard deviation are highlighted in red.

