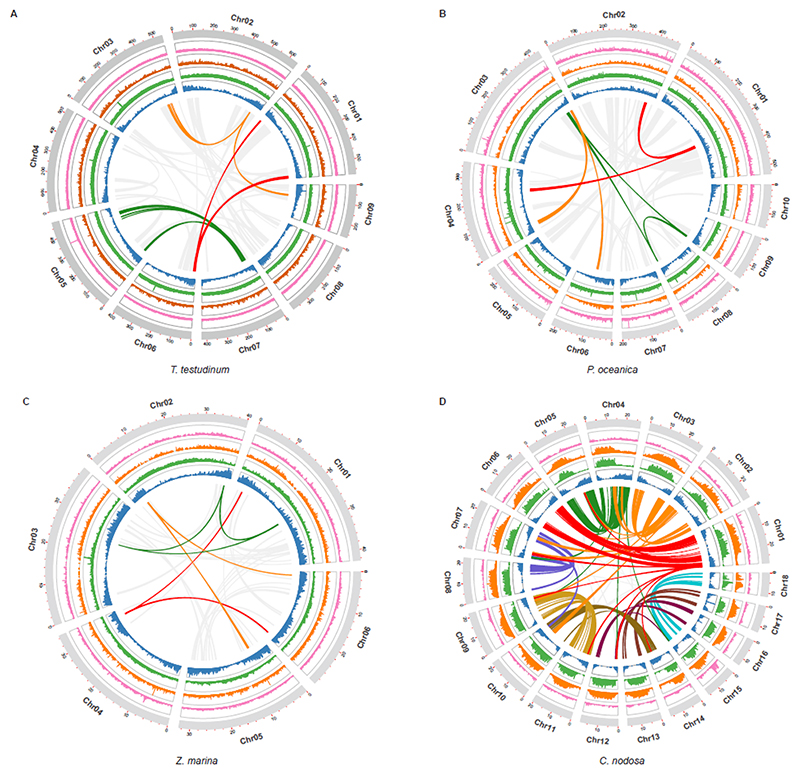
Figure 1. Distribution of the genomic features for the seagrass species T. testudinum, P. oceanica, Z. marina and C. nodosa.
Tracks from the inner to outer side correspond to gene density (blue); LTR/Gypsy density (green); LTR/Copia (orange); DNA transposable elements (pink) and chromosomes (with length in Mb). Curved lines through the center denote synteny between different genomic regions. Grey lines in A, B and C reflect synteny involving the WGD, whereas the three colored lines represent synteny with WGTs. Colored lines in D represent synteny and strong intragenomic conservation and should not be compared with colors in A, B and C (see text for further details). The distribution of the genomic features for the longest scaffolds of P. acutifolius, can be found in Supplementary Figure 2.1.2.

