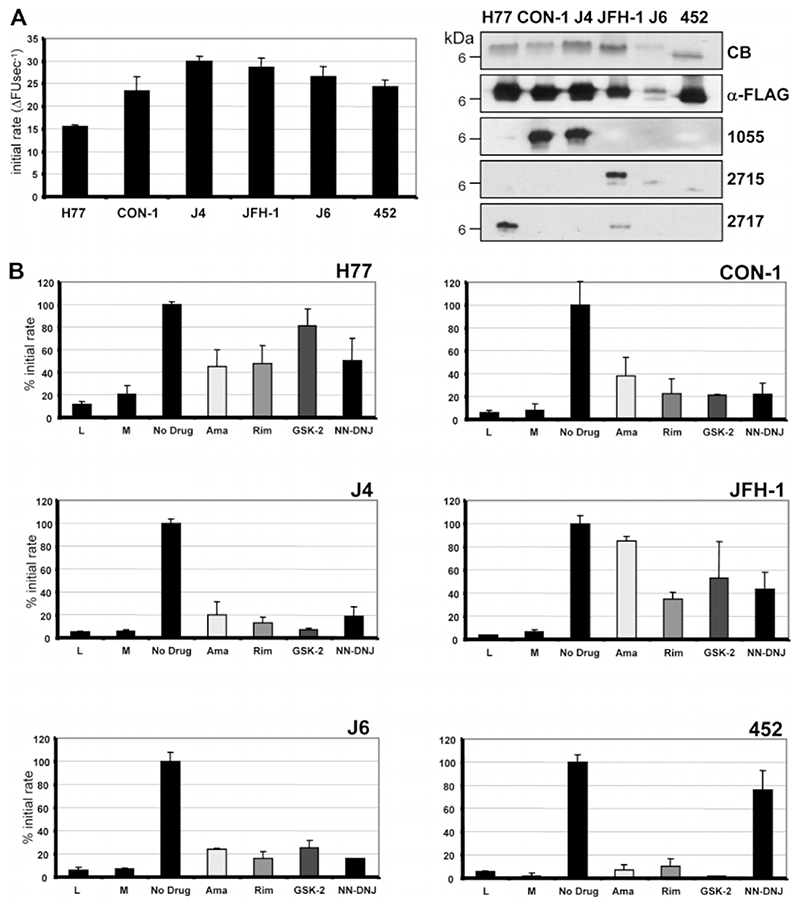
Fig. 5.
Effects of inhibitors on p7-mediated fluorescent dye release from liposomes. (A) Recombinant p7 for each genotype was expressed and purified from E. coli and its activity measured by fluorescent dye release from liposomes.23 The graph shows the initial rate of CF release as the change in fluorescent units per second (ΔFU second-1) averaged over the first five minutes of at least three separate repeats with different batches of protein. Purity and integrity of proteins was assessed by sodium dodecyl sulfate polyacrylamide gel electrophoresis (SDS-PAGE) and western blotting using anti-FLAG or anti-p7 antibodies. CB, Coomassie Blue stain; 1055, anti J4 p7 C-terminus; 2715, anti JFH-1 p7 N-terminus; 2717, anti JFH-1 p7 C-terminus. (B) Effects on initial rates relative to untreated (DMSO only; 100%) of adding inhibitors to assay at 1 μM concentration for each protein. L, liposomes only; M, methanol solvent control. Results are averages of at least three separate experiments with each condition performed in triplicate. Error bars represent standard errors of the mean.

