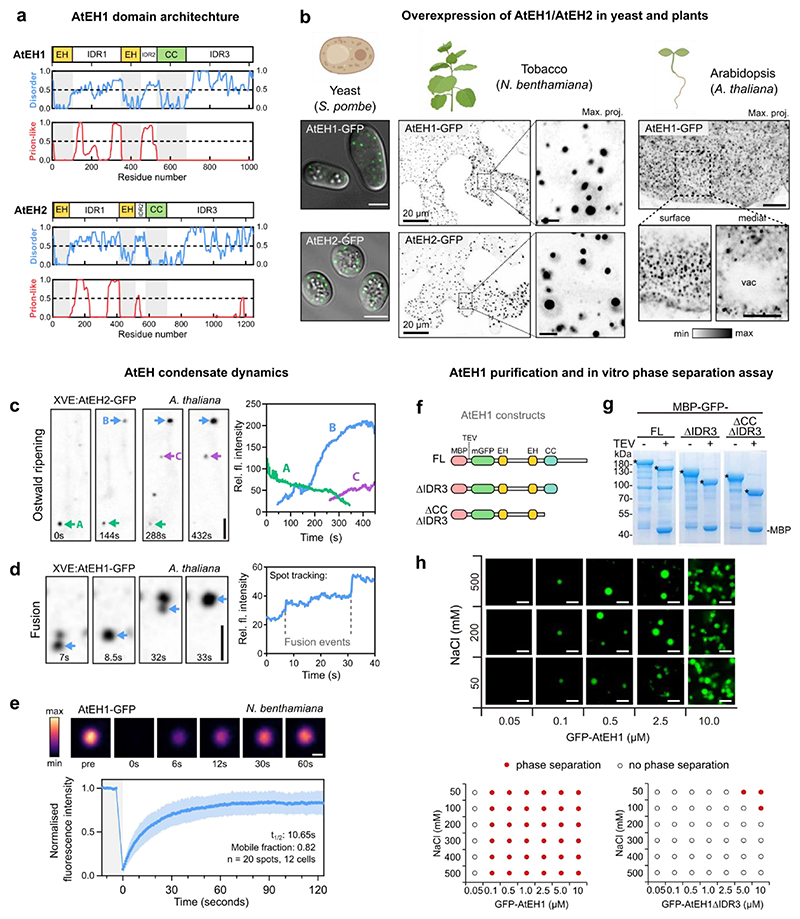
Figure 1. AtEH proteins phase separate in vivo and in vitro.
a, AtEH1 and AtEH2 domain architecture and prediction of disordered (MobiDB consensus) and prion-like (PLAAC) residues. Regions with values > 0.5 are considered disordered or prion-like, respectively. EH, Eps15 homology; CC, coiled-coil. b, Representative Airyscan images of AtEH1-GFP and AtEH2-GFP overexpressed in yeast (S. pombe), N. benthamiana epidermal cells (UBQ10:AtEH-mGFP), and in stable A. thaliana root epidermal cells (35S:AtEH1-GFP). (c-d) Time-lapse imaging of AtEH1 and AtEH2 under control of a β-estradiol inducible promoter (XVE) after 38 (c) or 22 (d) hours induction in A. thaliana root epidermal cells. Spot tracking and quantification of fluorescence intensity reveals puncta growth and shrinking through Ostwald ripening (c), and puncta fusion (d). e, Fluorescence recovery after photobleaching (FRAP) of AtEH1-GFP condensates in N. benthamiana epidermal cells. Data is mean ± SD. (f-h) Schematic of AtEH1 constructs used for recombinant protein purification (f). Constructs were purified as GFP-fusion proteins using an N-terminally located Maltose Binding Protein (MBP) tag with a Tobacco Etch Virus (TEV) cleavage site. g, Coomassie-stained SDS-PAGE gel of purified AtEH1 protein before and after TEV cleavage; * indicates AtEH1. h, in vitro phase separation assay and phase diagram of recombinant GFP-AtEH1. GFP-AtEH1ΔCCΔIDR3 did not phase separate at the tested conditions. Scale bars = 5 μm (b, c, d), 1 μm (e), 2 μm (h), or as otherwise indicated. For b-e, g-h experiments were performed three, or two times, respectively with similar results. See also Extended Data Fig. 1. Source data are provided as a Source Data file.

