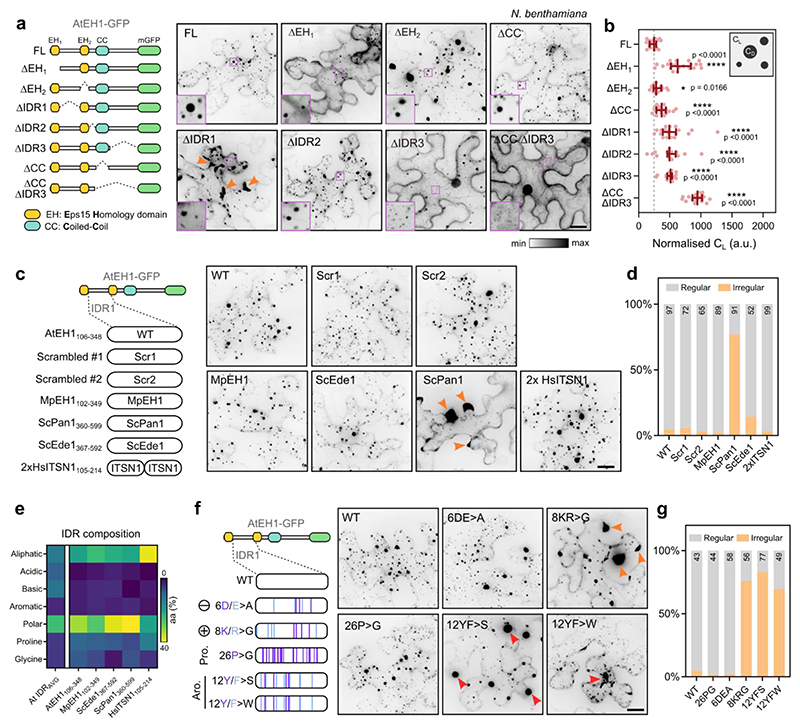
Figure 2. Condensation of AtEH1 is controlled by multiple regions, including IDR1.
a, Schematic of AtEH1 truncation constructs (UBQ10:AtEH1domain-GFP) and representative image in N. benthamiana. Insets show zoom in of condensates (dense phase; CD) and cytosol (light phase; CL). b, Quantification of cytosolic protein concentration (light phase; CL). Bars indicate median ± 95% CI. Higher values indicate a reduced ability to phase separate. Statistics indicate significance to FL; *p < 0.05, ****p <0.0001, unpaired t-test with Welch’s correction; n = 18, 21, 15, 19, 17, 17, 19, 19 cells. c, IDR swap experiment. The IDR1 of AtEH1 was scrambled (Scr) or replaced with an equivalent IDR from AtEH1 homologs from liverwort (Marchantia polymorpha; MpEH1), yeast (Saccharomyces cerevisiae; ScPan1, ScEde1), and human (Homo sapiens; HsITSN1). Representative images in N. benthamiana are shown. Orange arrowheads indicate irregular condensates appearing in cell lobes. d, Quantification of the condensate distribution in cells. The number of cells analysed is indicated. e, Heat map of amino acid composition of IDRs from the A. thaliana IDR proteome, and from the IDR1 of AtEH1 and equivalent sequences from related proteins. AtEH1 homologs are more similar to each other than to the average A.thaliana IDR sequence. Notably, ScPan1 contains few basic residues. (f-g) AtEH1 IDR1 mutation experiment. Proline, basic, acidic, and aromatic residues of the IDR1 of AtEH1 were mutated. Representative images in N. benthamiana are shown. Orange arrowheads indicate irregular condensates appearing at cell lobes, red arrowheads indicate condensates with abnormal morphology. g, Quantification of condensate distribution in cells. The number of cells analysed is indicated. Scale bars = 20 μm. For a-d,f-g experiments were performed three times with similar results. See also Extended Data Fig. 2. Source data are provided as a Source Data file.

