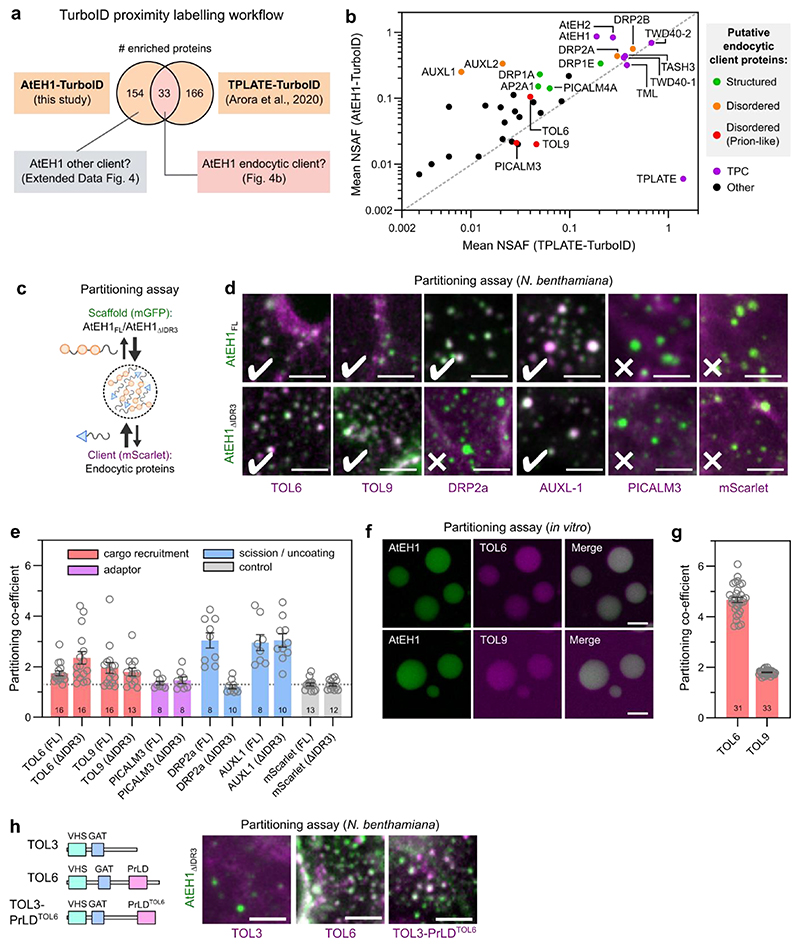
Figure 4. AtEH1 condensates selectively sequester endocytic machinery.
a, Interactomics strategy to identify endocytic client proteins of AtEH1. b, Enriched proteins in AtEH1 and TPLATE TurboID datasets were combined, and proteins common to both datasets are plotted. Auxilin-like1 and Auxilin-like2 were not enriched in the TPLATE-TurboID dataset, but included due to their high enrichment and abundance in the AtEH1-TurboID dataset. Proteins that function in endocytosis are coloured based on their disorder content. NSAF; normalised spectral abundance factor. c, Schematic of the partitioning assay. d, Representative images of scaffolds (AtEH1FL-GFP and AtEH1ΔIDR3-GFP) co-expressed with client proteins (Client-mScarlet) in N. benthamiana epidermal cells. e, Quantification of client partitioning. Values indicates partitioning co-efficient obtained for each cell. A partitioning coefficient of 1 indicates an absence of partitioning. Client proteins are coloured according to their function in endocytosis. Bars indicate mean ± SEM. The dashed line indicates the average background signal (mScarlet). f,g in vitro partitioning assay. Purified GFP-AtEH1 and TOL6-mCherry or TOL9-mCherry were combined. TOL6-mCherry and TOL9-mCherry did not phase separate individually. f, Quantification of client partitioning. Data indicate partitioning co-efficient from individual droplets. Bars indicate mean ± SEM. Numbers indicate the sample size (e, g). h, TOL chimera experiment. Representative images of TOL3, TOL6, or TOL3 fused with the Prion-like domain (PrLD) of TOL6 (mScarlet) co-expressed with AtEH1ΔIDR3-GFP in N. benthamiana. Scale bars = 5 μm. For d-h experiments were performed twice times with similar results. See also Extended Data Fig. 4. Source data are provided as a Source Data file.

