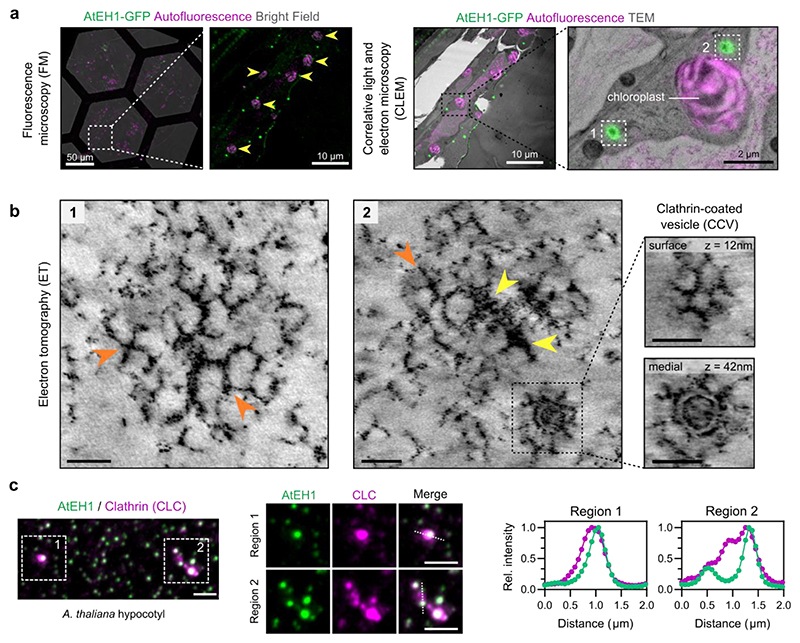
Figure 5. Condensation of AtEH1 facilitates clathrin recruitment and assembly.
a, Fluorescence and electron microscopy images of hypocotyl resin sections from A. thaliana seedlings over-expressing AtEH1 (35S:AtEH1-GFP). Yellow arrowheads indicate chloroplasts used as natural landmarks for correlation. b, Electron tomography (ET) reconstructions of the selected regions from a. Clathrin-like lattices and triskelia (orange arrowheads), and electron dense accumulations (yellow arrowheads) are formed within AtEH1 condensates. Inset shows a clathrin-coated vesicle (CCV) nearby the condensate. c, Representative airyscan images of clathrin light chain 2 (CLC-mKo) and AtEH1 (35S:AtEH1-GFP) in A. thaliana hypocotyl cells. Plot profiles show normalised fluorescence intensities from the indicated dashed lines. Clathrin is observed within and surrounding the condensates. Scale bars = as indicated (a), 50 nm (b), 2 μm (c). See also Extended Data Fig. 5; Video S2. Source data are provided as a Source Data file.

