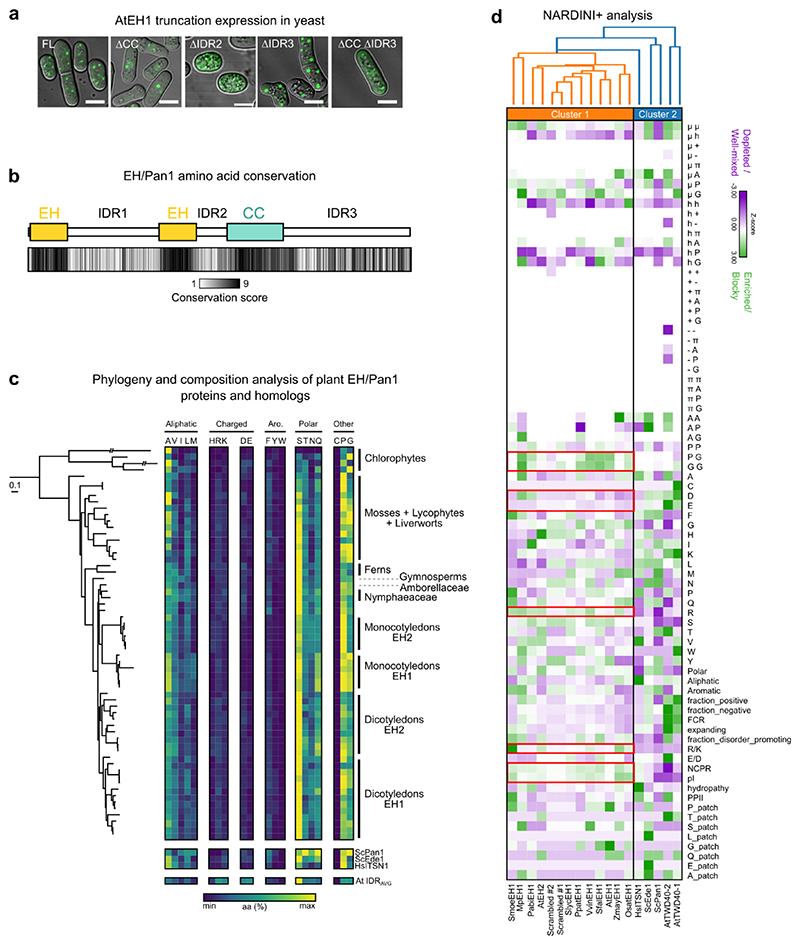
Extended Data Fig. 2 (Related to Figure 2). AtEH1 truncation construct expression in yeast, and evolutionary comparison of EH/Pan1 IDR1 amino acid composition across Archaeplastida.
a, Expression and condensate formation capacities of AtEH1 domain constructs in S. pombe. Scale bars = 5 μm. b, Conservation of amino acids at the single residue level based on Consurf analysis calculated using 128 AtEH homologous sequences throughout plant evolution. The average conservation score is indicated for each region (1 = 0% conservation, 9 = 100% conservation). IDR1 is highly variable at the individual amino acid level. c, Phylogenetic tree representing the maximum likelihood phylogeny of selected EH proteins. The phylogenetic tree was arbitrarily rooted to reflect phylogenetic relationships between chlorophyte and streptophyte lineages. The scale bar represents 0.1 amino acid substitution per site. The composition of the IDR1 for EH/Pan1 proteins is shown, with each amino acid plotted with the total number of each residue indicated. EH/Pan1 homologs from yeast (ScPan1, ScEde1), human (ITSN1), and the A. thaliana proteome average IDR are also indicated. d, NARDINI+ analysis of IDR patterning and compositional features from the IDR1 of AtEH1, AtEH2, and scrambled AtEH1 variants, homologous IDRs from liverwort (MpEH1), yeast (ScPan1, ScEde1), and human (HsITSN1) (used in Fig. 2c), IDRs from the TPLATE complex subunits TWD40-1/2, and the equivalent IDR from selected AtEH homologs throughout the plant kingdom. Z-score matrices are shown, with positive z-scores indicating non-random segregation between two types of residues, a blocky distribution of one type of residue, or the enrichment of the given sequence feature. Negative z-scores indicate non-random mixing between two types of residues, a uniform distribution of one type of residue, or the depletion of the given sequence feature. Red boxes indicate notable compositional features that differ between the two clusters including charged residue sequence features. Z-scores ≤ -1.5 and ≥ 1.5 are considered significant. μ, polar; h, hydrophobic; +, basic; –, acidic; π, aromatic; pI, isoelectric point; NCPR, net charge per residue; PPII, polyproline II propensity. The sequences used to construct the alignment in panel b and the phylogenetic tree in panel c are provided in the Source Data file. The experiment in a was performed two times with similar results.

