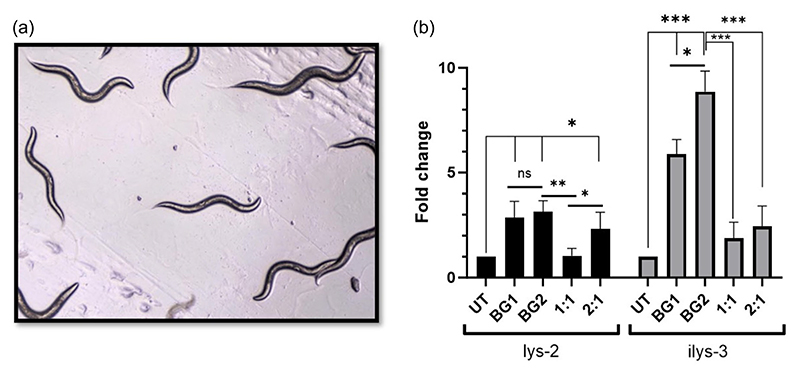
Figure 6. Gene expression analyses in C. elegans.
(a) Micrographic image of C. elegans on Day 0 of treatment. (b) Relative fold change of lys-2 and ilys-3 gene expression estimated via qPCR using the 2–ΔΔCt method and compared with the untreated control, with snb-1 as the reference gene for normalization. The BG:OP50 ratios tested were 1:1 and 2:1 where, 1:1 is 1 × 10⁴:1 × 10⁴ units/plate, and 2:1 is 2 × 10⁴:1 × 10⁴ units/plate of BG:OP50; BG1 = 1 × 10⁴ units/plate and BG2 = 2 × 10⁴ units/plate. *p < 0.05, **p < 0.005, ***p < 0.001 and ns: not significant. BG, bacterial ghost.

