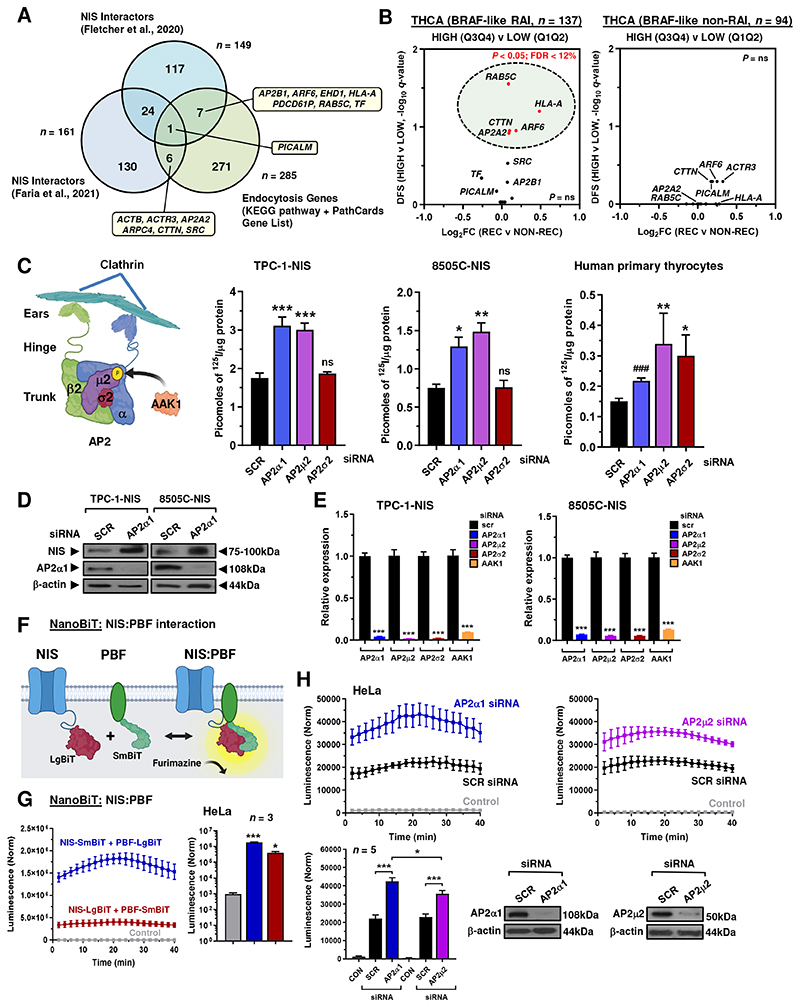
Figure 1. Modulation of AP2 expression increases RAI uptake.
A, Venn diagram showing overlap in NIS interactors from 2 mass spectrometry investigations versus endocytosis genes (KEGG pathway + Pathcards). 14 top candidates are highlighted. B, Volcano plot illustrating log2FC [recurrent (REC) versus non-recurrent (NON-REC)] compared to q-value (-log base 10) for DFS in RAI-treated (left) and non-RAI treated (right) BRAF-like THCA cohorts for 14 endocytic genes [high (Q3Q4) versus low (Q1Q2) tumoral expression]. P < 0.05 (green circle). C, Schematic (left) depicting AP2 subunits and interaction with clathrin/ AAK1. Created with BioRender.com. (right) RAI uptake of TPC-1-NIS cells, 8505C-NIS cells and human primary thyrocytes transfected with siRNA specific for indicated AP2 genes. D, Western blot analysis of NIS and AP2α1 protein in TPC-1-NIS and 8505C-NIS cells transfected with AP2α1 siRNA. E, Relative mRNA levels of AP2 genes and AAK1 in TPC-1-NIS and 8505C-NIS cells transfected with siRNA specific for indicated AP2 genes and AAK1. F, Schematic depicting NanoBiT assay to detect protein: protein interaction between NIS tagged with LgBiT and PBF tagged with SmBiT. The NanoLuc luciferase enzyme (LgBiT + SmBiT) relies on the substrate furimazine to produce high intensity, glow-type luminescence. G, Kinetic measurements in live HeLa cells to evaluate protein-protein interactions between NIS and PBF tagged with LgBiT or SmBiT as indicated. (right) NanoBiT assay results at 20 minutes post-addition of Nano-Glo substrate (n = 3). H, NanoBiT evaluation (upper) of protein: protein interaction between NIS and PBF in live HeLa cells transfected with siRNA specific for indicated AP2 genes. (lower) Normalised NanoBiT assay results at 20 minutes post-addition of Nano-Glo live cell assay substrate (n = 5). Western blot analysis of AP2α1 and AP2μ2 protein in HeLa cells transfected with indicated siRNA. Data presented as mean ± S.E.M., n = 3-7, one-way ANOVA followed by Dunnett’s or Tukey’s post hoc test (ns, not significant; *P < 0.05; **P < 0.01; ***P < 0.001), or unpaired two-tailed t-test (###P < 0.001).

