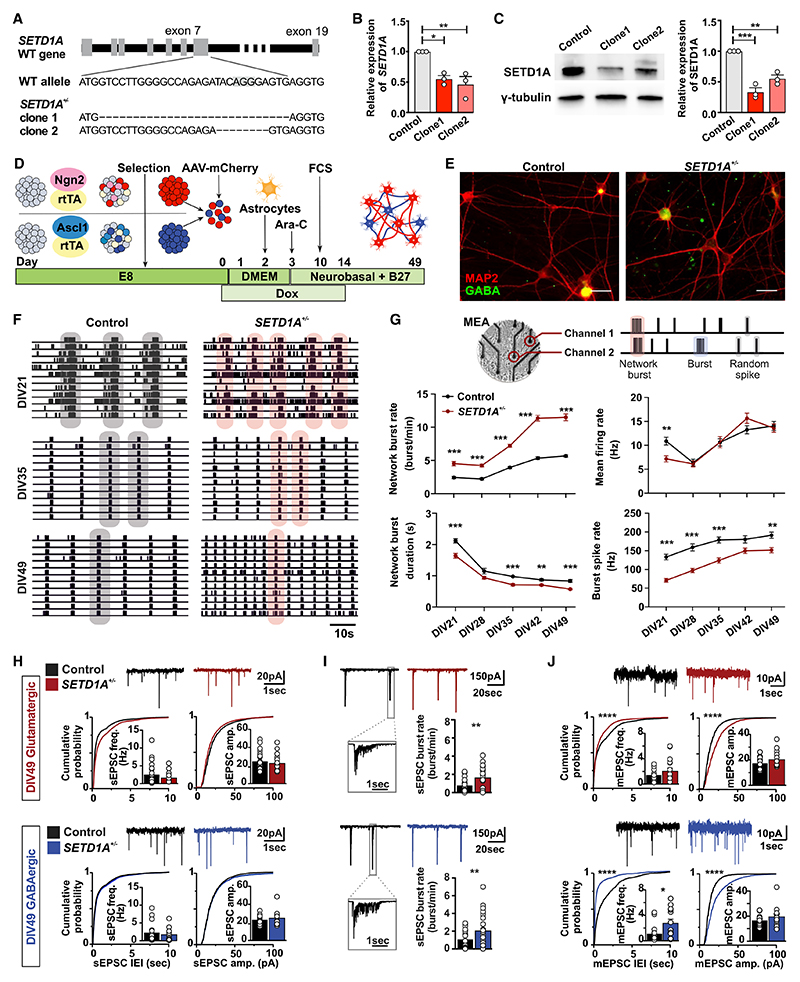
Figure 1. SETD1A+/− neuronal networks exhibit dysregulated functional organization.
(A) Generation of SETD1A isogenic lines (SETD1A+/−) using CRISPR-Cas9. The schematic shows the position of the single-guide RNA (sgRNA) sequence and indels generated in SETD1A+/− clone 1 and SETD1A+/− clone 2.
(B and C) qPCR and western blot showing reduced mRNA (B) and protein levels of SETD1A (C). n = 3 for each group.
(D) Schematic representation of the neuronal differentiation workflow.
(E) Immunofluorescence staining of GABA (green) and MAP2 (red) at DIV49. Scale bar, 30 μm.
(F and G) Analyses of neuronal activity using MEA recordings.
(F) Representative raster plots (1 min) of electrophysiological activity exhibited by control and SETD1A+/− neuronal networks at different time points during development. Gray and pink shadows show examples of network burst events.
(G) Schematic overview of an electrophysiological recording from neurons cultured on MEA (top panel) and quantification of network parameters as indicated (bottom panel). Sample size: control n = 40 MEA wells, SETD1A+/− n = 63 (clone 1 = 15, clone 2 = 48) MEA wells from 5 independent batches.
(H and I) Representative whole-cell voltage-clamp recordings and quantitative analyses of (H) spontaneous excitatory postsynaptic currents (sEPSCs) and (I) correlated synaptic inputs (sEPSC bursts) in glutamatergic and GABAergic neurons in control and SETD1A+/− E/I cultures at DIV49. sEPSC frequency and amplitude: glutamatergic neurons: control n = 21 cells; SETD1A+/− n = 19 cells (clone 1 = 13, clone 2 = 6); GABAergic neurons: control n = 18 cells, SETD1A+/− n = 16 cells (clone 1 = 11, clone 2 = 5). sEPSC burst: glutamatergic neurons: control n = 24 cells, SETD1A+/− n = 24 cells (clone 1 = 14, clone 2 = 10); GABAergic neurons: control n = 22 cells, SETD1A+/− n = 22 cells (clone 1 = 11, clone 2 = 11).
(J) Representative whole-cell voltage-clamp recordings and quantitative analyses of mEPSC activity in glutamatergic and GABAergic neurons. Glutamatergic neurons: control n = 17 cells, SETD1A+/− n = 16 cells from clone 1; GABAergic neurons: control n = 16 cells, SETD1A+/− n = 13 cells from clone 1.
Data represent mean ± SEM. *p < 0.05, **p < 0.01, ***p < 0.001, two-way ANOVA with post hoc Bonferroni correction (G), Student’s t test with Bonferroni correction for multiple testing (H–J), or Kolmogorov-Smirnov test (H) for comparing control and SETD1A+/− cultures.

