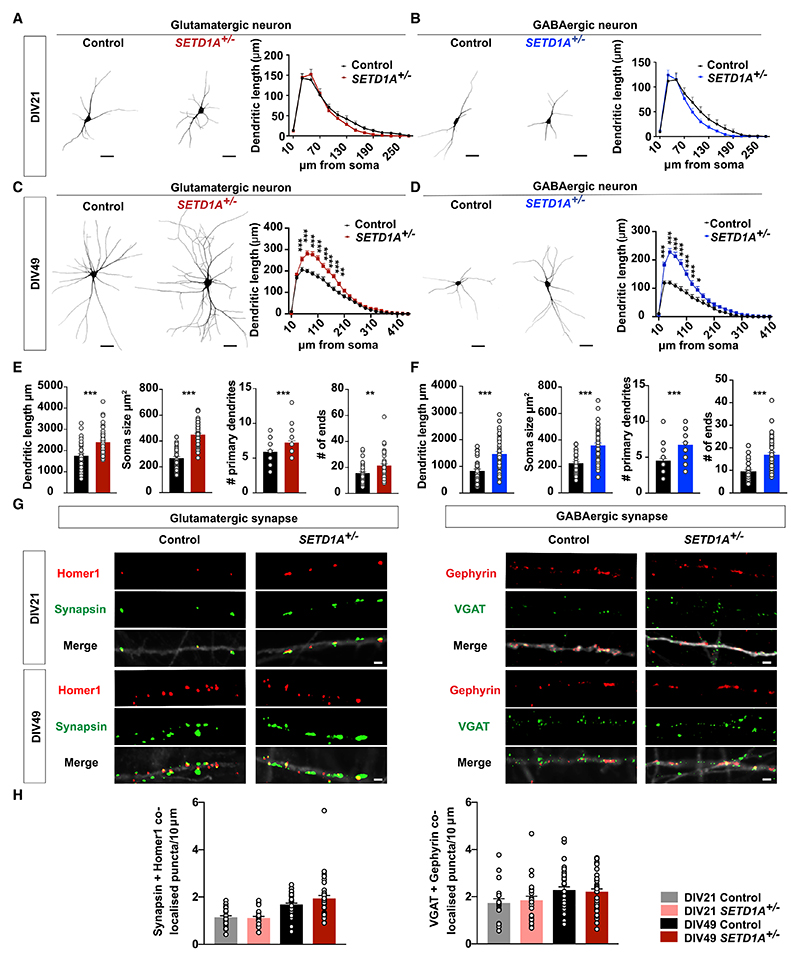
Figure 2. SETD1A+/− neurons show aberrant somatodendritic morphology.
(A and B) Representative somatodendritic reconstructions of glutamatergic (A) and GABAergic (B) neurons and Sholl analysis in control and SETD1A+/− neurons at DIV21 (glutamatergic neurons: n = 20 for control, n = 20 for SETD1A+/− from clone 1; GABAergic neurons: n = 18 for control, n = 21 for SETD1A+/− from clone 1). Dendritic length represents the length of dendrites that occur at fixed distances from the soma in concentric circles. Scale bars, 40 μm.
(C and D) Representative somatodendritic reconstructions of glutamatergic (C) or GABAergic (D) neurons and Sholl analysis in control and SETD1A+/− networks at DIV49 (glutamatergic neurons: n = 38 for control, n = 47 for SETD1A+/− [clone 1 = 23, clone 2 = 24]; GABAergic neurons: n = 33 for control, n = 45 for SETD1A+/− [clone 1 = 22, clone 2 = 23]). Scale bars, 40 μm.
(E and F) Main morphological parameters in reconstruction for glutamatergic neurons (E) and GABAergic neurons (F) at DIV49.
(G) Representative images of immunocytochemistry stained for glutamatergic synapse (synapsin as a presynaptic marker and Homer1 as a postsynaptic marker) and GABAergic synapse (VGAT as a pre-synaptic marker and Gephyrin as a post-synaptic marker). Scale bar, 2 μm.
(H) Quantification of the density of co-localized Synapsin/Homer1 and VGAT/Gephyrin puncta (number per 10 μm). Synapsin/Homer1: n = 25 for control, n = 19 for SETD1A+/− at DIV21 from clone 1; n = 34 for control, n = 36 for SETD1A+/− at DIV49 (clone 1 = 26, clone 2 = 10); VGAT/Gephyrin: n = 18 for control, n = 23 for SETD1A+/− at DIV21 from clone 1; n = 34 for control, n = 36 for SETD1A+/− at DIV49 (clone 1 = 26, clone 2 = 10).
Data represent mean ± SEM. *p < 0.05, **p < 0.01, ***p < 0.001, two-way ANOVA with post hoc Bonferroni correction (A–D), unpaired Student’s t test (E and F), or one-way ANOVA with post hoc Bonferroni correction (H).

