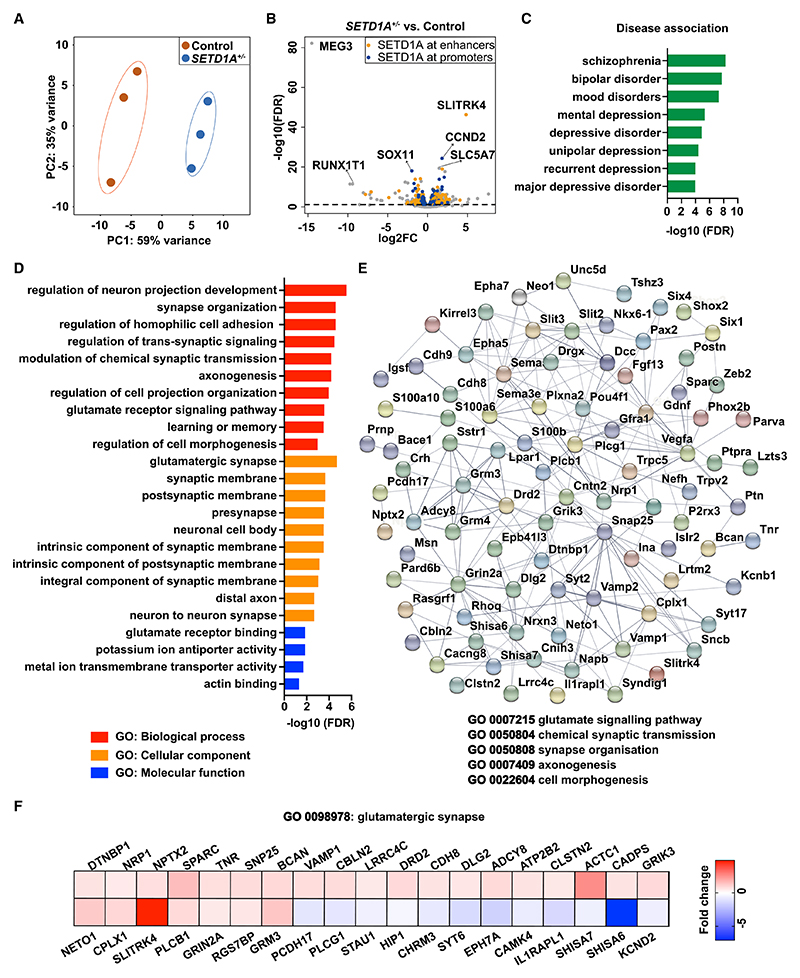
Figure 3. SETD1A haploinsufficiency leads to an altered transcriptomics profile.
(A) PCA showing tight clustering of 3 replicates for each genotype. SETD1A+/− was from clone 1.
(B) Volcano plots showing differentially expressed genes (DEGs) between SETD1A+/− and control E/I cultures. Relative to the control, significantly up- or down-regulated genes are shown above the black dashed line. Among these 919 DEGs, 556 (61%) genes are predicted to be SETD1A target genes (labeled in orange and blue) by comparing our DEGs with the published ChIP-seq database of SETD1A (Mukai et al., 2019). The top 3 upregulated and downregulated DEGs are labeled with the gene name.
(C) Disease terms of the DisGeNET database associated with DEGs.
(D) Gene Ontology (GO) term analysis of DEGs.
(E) Diagram of the dysregulated protein network, showing the interactions among several synaptic functions using STRING.
(F) Heatmap showing the fold change of DEGs compared with the control in gene sets related to glutamatergic synapses.

