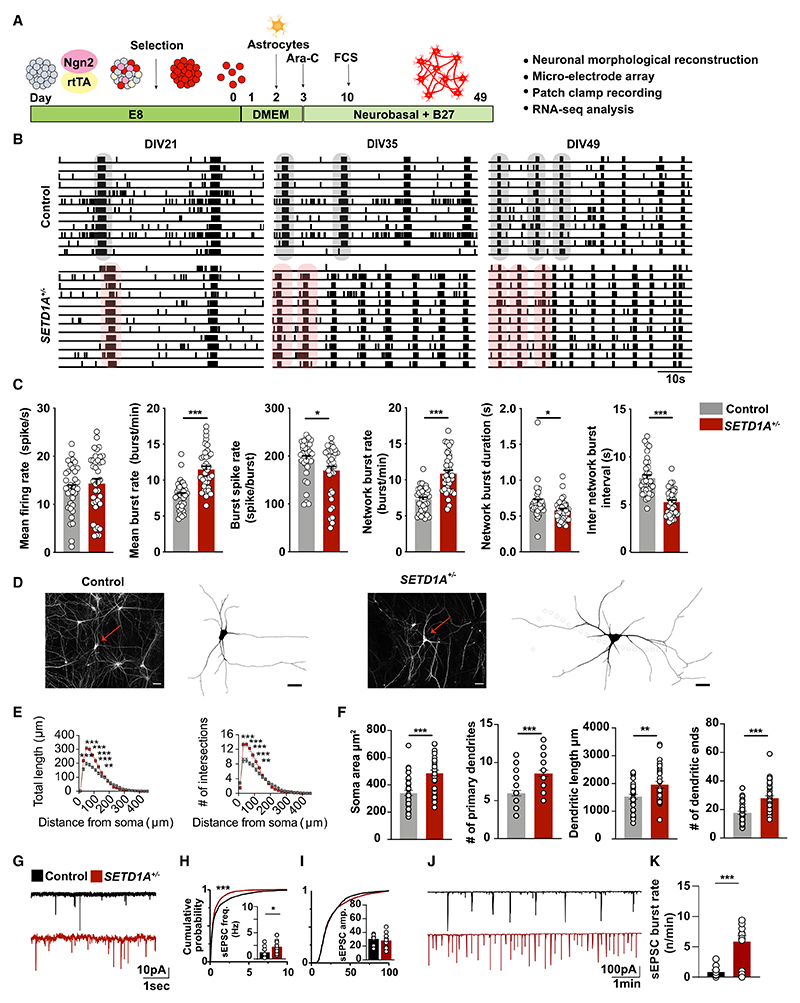
Figure 4. SETD1A+/− glutamatergic neuronal cultures recapitulate the SETD1A+/− E/I network phenotype.
(A) Schematic of the neuronal differentiation workflow.
(B) Representative raster plots (1 min) of electrophysiological activity measured by MEA from control and SETD1A+/− glutamatergic neuronal networks at different time points during development.
(C) Quantification of network parameters as indicated at DIV49. Sample size: control n = 35 MEA wells, SETD1A+/− n = 37 MEA wells from 4 independent batches (n = 25 from clone 1, n = 12 from clone 2).
(D and E) Representative somatodendritic reconstructions of glutamatergic neurons and Sholl analyses in control and SETD1A+/− networks at DIV 49 (n = 38 for control, n = 33 for SETD1A+/− from clone 1). Red arrows indicate neurons reconstructed in the images. Scale bars, 40 μm.
(F) Main morphological parameters for reconstruction of glutamatergic neurons at DIV49.
(G–I) Representative voltage-clamp recordings of spontaneous inputs (sEPSCs) onto glutamatergic neurons at DIV49 and the corresponding quantitative analyses of sEPSC frequency (H) and amplitude (I).
(J and K) Representative voltage-clamp recordings of correlated synaptic inputs (sEPSC bursts) in control and SETD1A+/− glutamatergic neurons at DIV49 and the corresponding quantitative analyses (K). n = 24 for control, n = 17 for SETD1A+/− clone 1 at DIV49.
Data represent mean ± SEM. *p < 0.05, **p < 0.01, ***p < 0.001, two-way ANOVA with post hoc Bonferroni correction (E), unpaired Student’s t test (C, F) or Students’ T test with Bonferroni correction for multiple testing (H, I, K).

