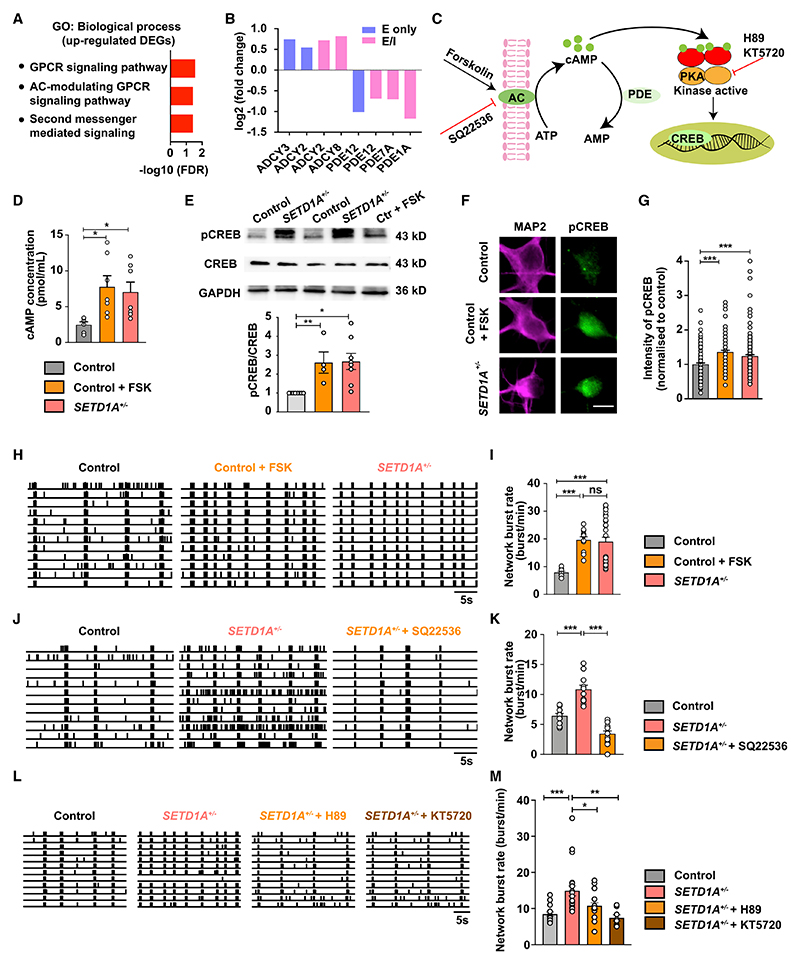
Figure 5. SETD1A haploinsufficiency leads to activation of the cAMP/PKA/CREB pathway.
(A) GO terms related to second messenger signaling associated with upregulated DEGs.
(B) Change of mRNA levels of genes coding for adenylyl cyclase (AC) and phosphodiesterases.
(C) Schematic of the cAMP/PKA/CREB pathway and drug targets at different steps.
(D) cAMP concentrations for control (n = 6), control + 1 μM FSK (n = 7), and SETD1A+/− cultures (n = 7 from clone 1).
(E) Western blot of pCREB, CREB, and glyceraldehyde 3-phosphate dehydrogenase (GAPDH) for control (n = 8), control + 1 μM FSK (n = 4), and SETD1A+/− cultures (n = 8 from clone 1).
(F and G) Representative images showing pCREB expression and quantification of intensity of pCREB for control (n = 134 cells), control + 1 μM FSK (n = 96 cells),and SETD1A+/− neurons (n = 156 cells, from 3 independent batches; n = 34 from clone 1 and n = 122 from clone 2). Scale bar, 10 μm.
(H and I) Representative raster plot for 30 s recorded by MEA and quantification of network burst rate, showing the effect of the AC agonist FSK (1 μM) on control networks (sample size: control n = 10 wells, control + FSK n = 12 wells, SETD1A+/− n = 28 wells [n = 6 from clone 1 and n = 22 from clone 2]).
(J and K) Representative raster plot for 30 s recorded by MEA and quantification of network burst rate, showing the effect of the AC inhibitor SQ22536 (100 μM) on SETD1A+/− E/I cultures (sample size: control n = 11 wells, SETD1A+/− + SQ22536 n = 13 wells, SETD1A+/− n = 13 wells from clone 2).
(L and M) Representative raster plot for 30 s recorded by MEA and quantification of network burst rate, showing the effect of the PKA inhibitors H89 (2 μM) and KT5720 (1 μM) on SETD1A+/− E/I cultures (sample size: control n = 15 wells, SETD1A+/− + H89 n = 18 wells [n = 3 from clone 1 and n = 15 from clone 2], SETD1A+/− + KT5820 n = 8 wells [n = 2 from clone 1 and n = 6 from clone 2], SETD1A+/− n = 22 wells [n = 7 from clone 1 and n = 15 from clone 2]).
Data represent mean ± SEM. *p < 0.05, **p < 0.01, ***p < 0.001, one-way ANOVA test and post hoc Bonferroni correction.

