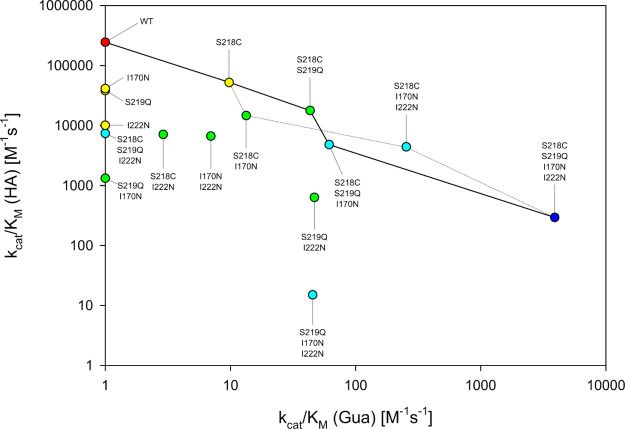
Figure 3.
Activity changes in the sequence space connecting AtzB and AtzB-S218C S219Q I170N I222N (AtzB-CQNN). Catalytic efficiency (kcat/KM) for hydroxyatrazine (HA) is plotted against kcat/KM for guanine (Gua) for all AtzB variants contained in the sequence space between wild-type AtzB and AtzB-CQNN. The mutations are listed in the order of their introduction. Values shown are the average of triplicate measurements and are explicitly listed in Tables S2 and S3. Activities that are too low to be determined are represented as kcat/KM = 1 M–1 s–1. Colors indicate the number of mutations relative to the wild type (0 = red; 1 = yellow; 2 = green; 3 = light blue; 4 = dark blue). The main trajectory that led from AtzB to AtzB-CQNN is indicated by a solid line. An alternative trajectory that features similar activity trade-offs is shown by a dashed line.

