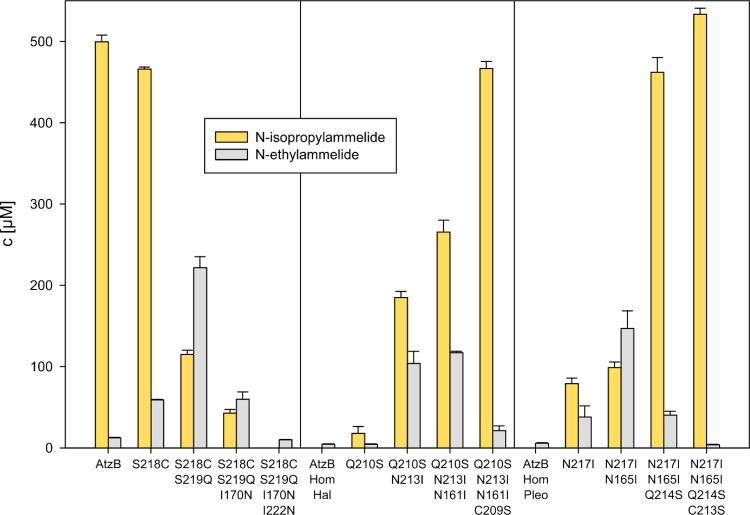
Figure 5.
Product composition of hydroxyatrazine hydrolysis by wild-type AtzB, AtzB_Hom_Hal, and AtzB_Hom_Pleo, as well as relevant mutants. Mutants making up the main trajectories shown in Figures 3 and 4 were investigated for their product composition resulting from hydrolysis of 500 μM hydroxyatrazine by 2 μM enzyme over 20 h at 25 °C. The graph shows the resulting concentrations of the respective product as determined by HPLC analysis of three replicas. The raw data are shown in Figure S3.

