


Fig. 2.
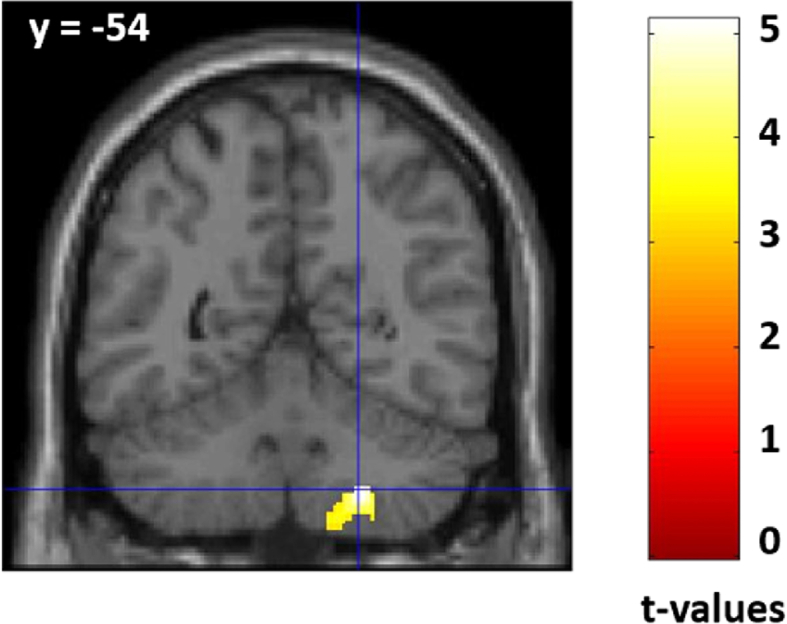
Statistical parametric map for correlation between LSA cosine similarity and gray matter volume. Right cerebellum was significantly correlated with LSA cosine similarity (peak: [x, y, z] = [22.5, −54, −46.5]; t-value = 5.11; p = 0.034, voxel-wise whole-brain FWE corrected for multiple comparison). For visualization purposes, voxels that survive at p < 0.001 uncorrected (t = 3.16, cluster size = 506) are depicted.