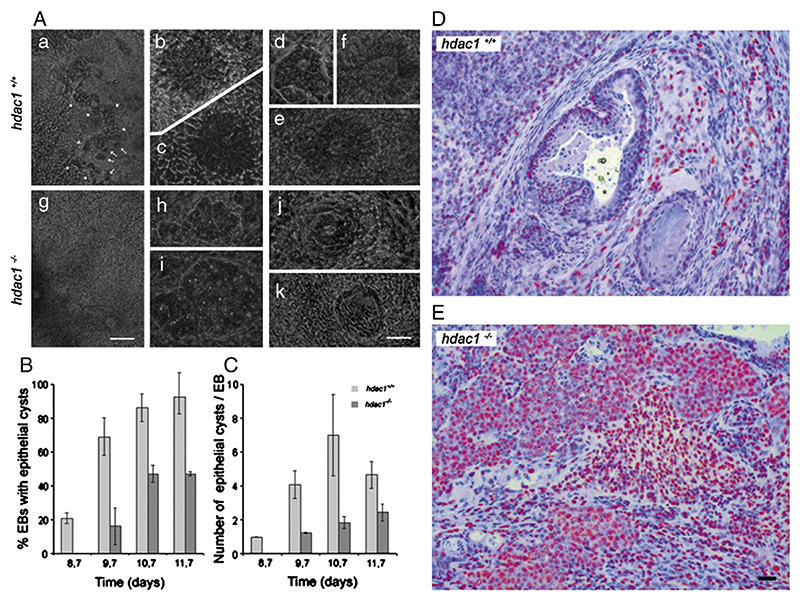
Figure 1. Development of epithelial cysts in hdac1−/− EBs and teratoma.
(A to C) Wild type (hdac1+/+) and hdac1−/− ESCs were aggregated in hanging drop cultures for 4.7 days and then plated on gelatine coated tissue culture plates. Development of epithelial cysts was monitored between days 5 and 14. First epithelia cysts become visible between days 8 and 8.7. (A) Phase contrast images of hdac1+/+ and hdac1−/− EBs. (a and g) Overview of a typical area adjacent to the center of EBs at day 11. Long arrows, single isolated epithelial cysts. Short arrows, large layers of epithelial cells. (b and c) Primitive epithelial cysts forming between days 8 and 9 in hdac1+/+ EBs. (d to e) Fully developed columnar-epithelial cysts with a clearly visible lumen forming in hdac1+/+ EBs between days 10 and 12. (h and i) Early cysts with non-epithelial small cells forming between days 8 and 9 in hdac1−/− EBs. (j and k) Samples of rarely found cysts with a lumen in hdac1−/− EBs. Note, cells in h to k never develop to a columnar epithelial phenotype. Bars in g (for a and g), 1 mm; in k (for b to e, and h to k), 200 μm. (B) Percentage of EBs with epithelial cysts between days 8.7 and 11.7. (C) Number of epithelial cysts per EB. Data from days 9.7 and 10.7 are from two independent triplicate experiments. Data from days 8.7 and 11.7 are from one triplicate experiment. Mean number of EBs checked per day, 53 +/− 16. Error bars: standard deviation. (D and E) Teratoma were generated from 3 × 10⁶ mouse wild-type (D) and HDAC1-deficient (E) ES cells. Cells were subcutaneously injected in SCID/Balb/c mice and teratoma formation as well as tumor size was monitored every 4 days. Recipient SCID mice were killed after 28 days post-injection and teratoma of both genotypes was removed and analyzed by immunohistochemistry with HDAC2 antibodies (red). Bar in D and E: 170 μm. 3 tumors per cell line were used for statistical analysis and cell counts.
Panels D and E with permission from EMBO Journal adapted from Lagger et al. (2010).

