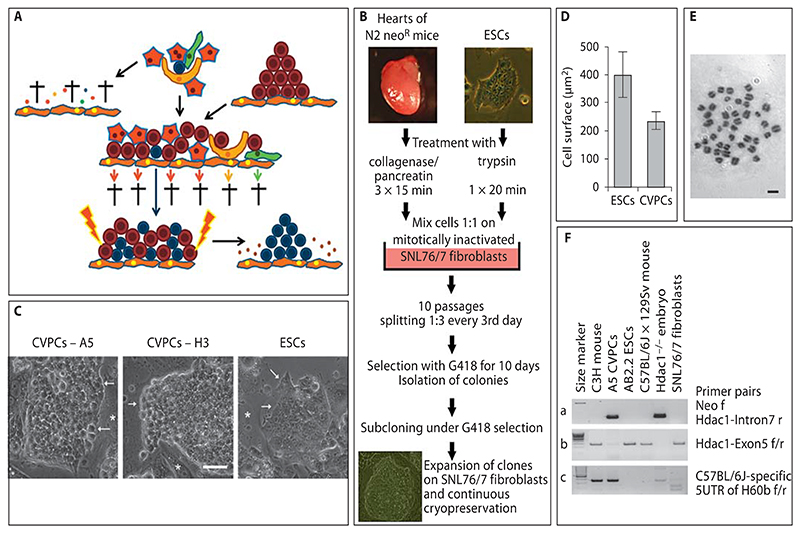
Fig. 1. Isolation procedure and phenotype of clonal CVPC lines.
A Rationale for the isolation strategy. Putative CVPCs (blue) are embedded between hypothetical niche cells (yellow), cardiac fibroblasts (green), and CMCs (red) in the heart (top of the illustration). All other cell types such as ETCs and SMCs were omitted for clarity reasons. If the heart tissue is dissociated and cells are explanted on fibroblasts (orange), all cell types die during long-term culture (arrow to the left). Small dots are fragments of dead cells. If cells are cultured in the presence of ESCs (brown) and in the presence of LIF-secreting feeder cells (orange) (middle of the illustration), all cell types except the CVPCs die or are diluted out during frequent passaging (lower part of the illustration). After CVPCs have reached a critical number allowing self-supportive self-renewal, removal of ESCs by drug selection should give rise to pure populations of continuously proliferating CVPCs (arrow to the right). B Workflow for the isolation of CVPCs. Triturated heart cells (5 × 10⁵) and ESCs were mixed and cultured on mitotically inactivated SNL76/7 feeder cells for 10 passages. Then ESCs were selectively removed by addition of G418 and colonies of CVPCs were subcloned, expanded, and frozen. C Morphology of CVPC colonies from clones A5 and H3 and from ESCs. Phase-contrast images. Arrows indicate discontinued rough borders of CVPC colonies with a rather loose arrangement of cells (bright space between cells), and tightly sealed borders of very densely packed ESC colonies, respectively. Asterisks indicate feeder cells. Scale bar = 50 μm. D Size of CVPCs and ESCs 3 days after plating on gelatine-coated culture plates. Error bars indicate the standard deviation. Number of cells = 55 each. p < 0.05. E Chromosome spread from an A5 CVPC demonstrating a diploid karyotype. Giemsa stain, bright-field image. Scale bar = 10 μm. F PCR analysis of DNA from A5 CVPCs, from mouse strains C3H, outbred wild-type C57BL/6J × 129Sv, and outbred Hdac1–/– C57BL/6J × 129Sv (Hdac1–/– embryo as a positive control), and from AB2.2 ESCs and SNL76/7 fibroblasts with a primer pair specific for the neomycin resistance cassette and intron 7 of the Hdac1 gene (a), exon 5 of the Hdac1 gene (b), and a C57BL/6J-specific region in the H60b gene (c). Left lanes, 100-bp size standard; thick lane = 500 bps.

