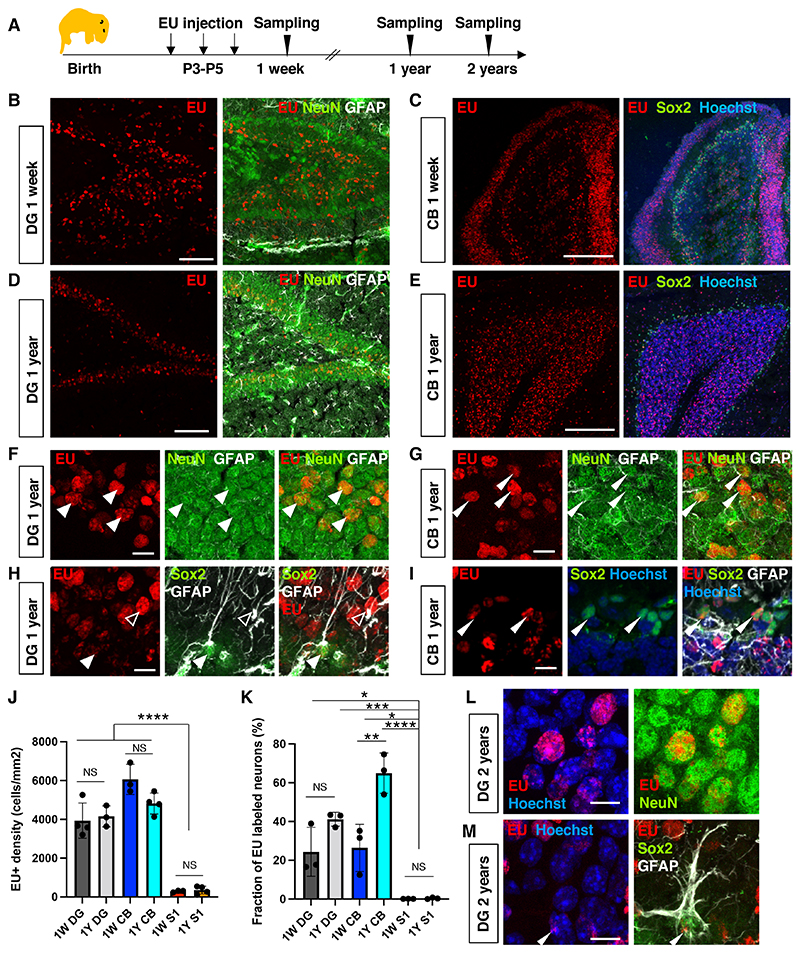
Fig. 1. Long-term retention of RNA in the mouse brain.
(A) Schematic diagram of experimental plan. RNA synthesis at P3-P5 was labeled using 5-Ethynyl-uridine (EU). (B) EU signals in the dentate gyrus (DG) of a 1-week-old animal. (C) EU signals in the cerebellum (CB) of a 1-week-old animal. (D) EU signals in the DG of a 1-year-old animal. (E) EU signals in the CB of a 1-year-old animal. (F-H) High magnification images with Sox2/GFAP immunostaining (arrowhead, RGL-ANSC; open arrowhead, astrocytes) or NeuN/GFAP staining (arrowheads, NeuN+ neurons). (J) Quantification of the density of EU+ cells. 1W (1-week-old) DG 3933 ± 911.9 cells/mm2; 1W CB 6060 ± 774.3 cells/mm2; 1W S1 291.8 ± 52.12 cells/mm2. 1Y (1-year-old) DG 4156 ± 542 cells/mm2; 1Y CB 4816 ± 537 cells/mm2; 1Y S1 359 ± 199 cells/mm2; NS not significant; ANOVA with post-hoc Tukey’s test. Data are presented as mean +/- standard deviation (SD). (K) Quantification of the percentage of EU+ neurons (NeuN+ cells). (L) EU signal in neurons of the DG in a 2-year-old animal. (M) EU signals in a neural stem cell (RGL-ANSC) in the DG of a 2-year-old animal. Data are presented as mean +/- SD. Scale bars, 100 μm (B, D), 10 μm (F-I, L, M), 200 μm (C, E). ANOVA followed by Tukey’s multiple comparison test; *P < 0.05, **P < 0.01, **P < 0.001, ****P < 0.0001.

