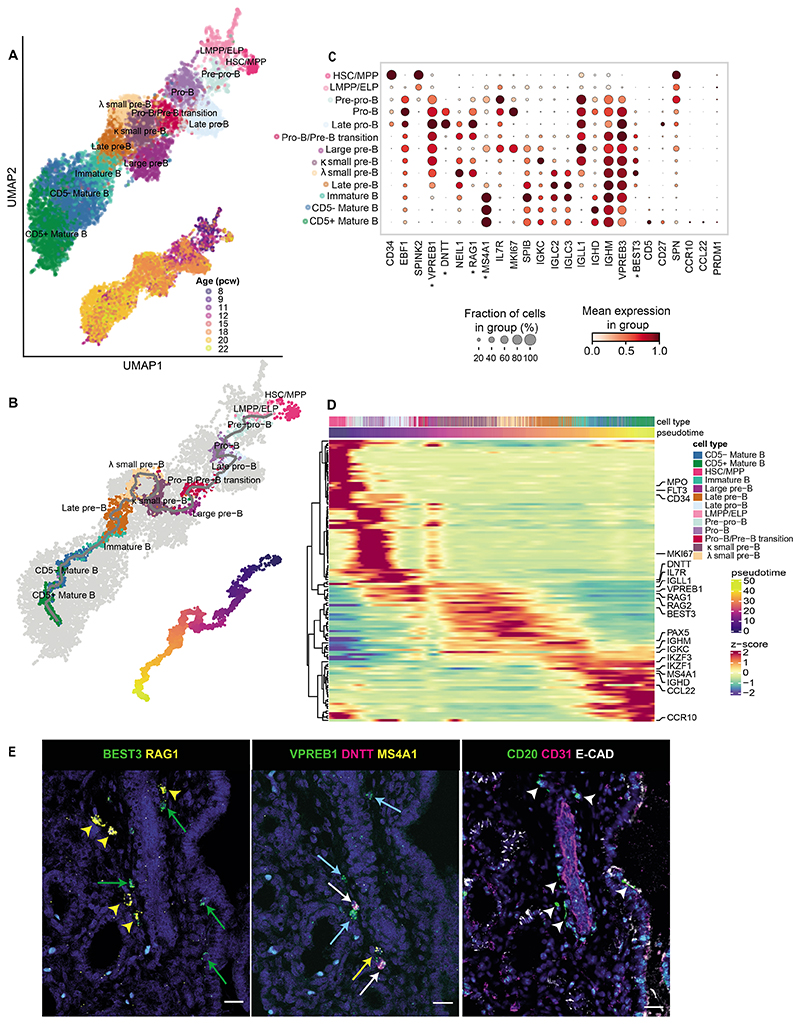
Figure 3. B cell development in fetal lungs.
(A, B) UMAPs of the B cell lineage showing (A) cell type clusters (top) and developmental stage of the corresponding samples in pcw (bottom); and (B) inferred trajectory from HSC/MPP to mature B cells using monocle3 (top) and the corresponding pseudotime (bottom). (C) B cell marker gene expression. (D) Clustermap (optimal leaf ordering) showing expression of the top 100 differential genes from the trajectory in (B). The cells (columns) are ordered by pseudotime. (E) RNAscope using sequential tissue sections from 20 pcw fetal lungs (left and center) showing expression of B progenitor markers (labeled with asterisks in (C); yellow arrowheads (small pre-B): BEST3+RAG1+;green arrows (large pre-B): BEST3+RAG1-; white arrows (pro-B): VPREB1+DNTT+; blue arrows (pre-B): VPREB1+; yellow arrows (late pre-B): VPREB1+MS4A1+). Corresponding IHC (right) using the next sequential tissue section, shows expression of CD20, CD31 (endothelium/blood vessels) and ECAD (epithelium) (arrowheads: CD20+ B cells). In all images, blue: DAPI+ nuclei; scale bar=20μM. See also Fig S5.

