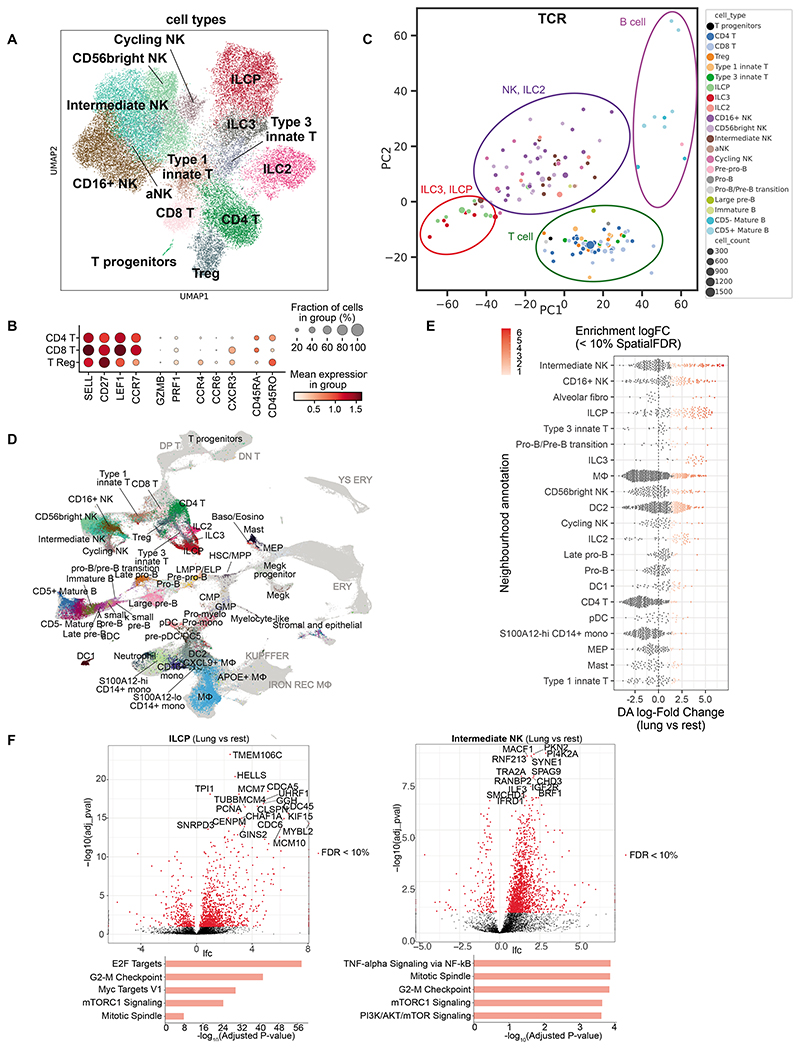
Figure 4. T cells, ILCs and NK cells in fetal lungs.
(A) UMAP showing lymphocytes except B cells. (B) Expression of marker genes for naive and mature T cells. (C) PCA plot summarizing TRBJ and TRBC gene segment usage proportion in different cell types. Each dot represents a biosample of at least 20 cells (size for cell count). Colored circles illustrate groupings of cell types. (D) UMAP of scVI integrated fetal immune cells from lung and 9 hematopoietic, lymphoid and non-lymphoid tissues. Fetal lung cells are colored by their cell type annotation while others are in grey. DP T, double-positive T cells; DN T, double-negative T cells; YS ERY, yolk sac-derived erythroid; ERY, erythroid; KUPFFER: Kupffer-like macrophages; IRON REC MΦ, Iron-recycling macrophages. (E) Beeswarm plot showing the distribution of log fold change in abundance between lung cells and all other organs in neighborhoods containing cells from different lung cell type clusters. Only differential abundance neighborhoods at SpatialFDR 10% and logFC > 0 are colored. (F) Differential gene expression comparing fetal lung with other organs in ILCPs and intermediate NK cells. Below are the top 5 enriched biological processes GO terms for upregulated genes. See also Fig S6 and S7.

