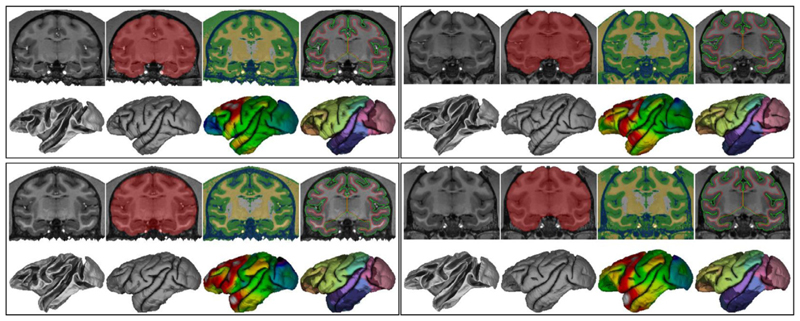
Fig. 10.
CIVET-macaque results for 4 NMT subjects. Within each set of images for a single subject, the top row, from left to right: coronal slice of the T1w image, brain mask, tissue classification (CSF in blue, cortical GM in green, portions of non-cortical GM in white, WM and other non-cortical GM in yellow), and cortical surfaces overlaid on the T1w image (WM surface in red, pial surface in green) bottom row, from left to right: white and pial surfaces; cortical thickness (range 1.0 mm light blue to 3.0 mm red) and the Level-4 CHARM parcellation viewed on the pial surface (52 ROIs).

