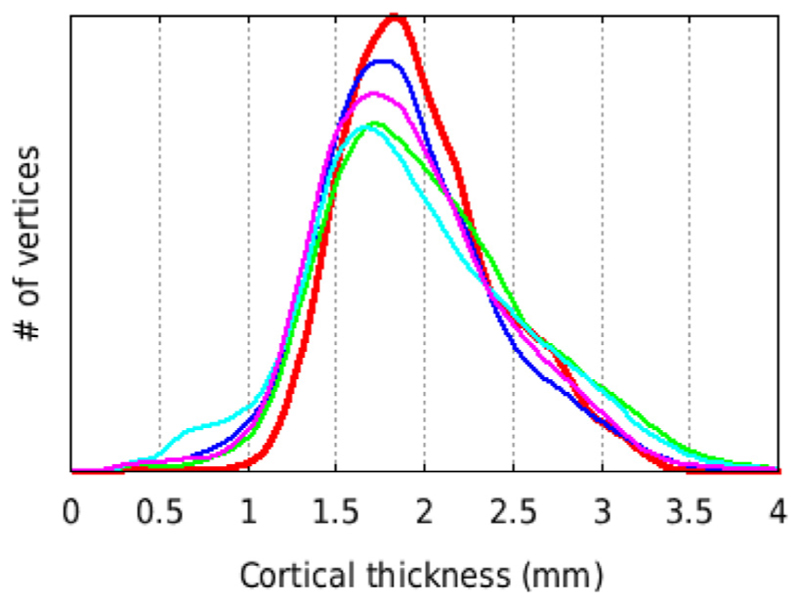
Fig. 12.
Histogram of mean cortical thickness for N = 29 subjects of the NMT dataset (red thick line) and for 4 single NMT subjects (thin lines), using the tlaplace metric with no spatial smoothing (fwhm = 0 mm). All 5 curves show the same total number of vertices (40,962 × 2 hemispheres) and area under the curve. The distribution for the mean curve is narrower (i.e., more central) than for most individual subjects. Consequently, the mean also has a higher peak than the other distributions.

