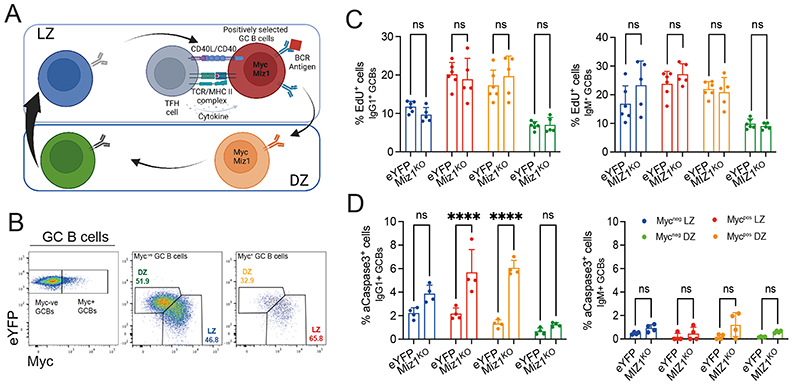
Fig. 3. Miz1 is required for IgG1+ GC B cell survival during positive selection.
(A) Schematic of Mycneg LZ, Mycpos LZ, Mycpos DZ, Mycneg DZ four consecutive GC B cell populations, and processes involved during positive selection.
(B) Gating strategy for the four consecutive GC B cell populations as in (A).
(C) Percentages of EdU+ cells within each of the four consecutive GC B cell populations in both eYFP and MIZ1KO mice.
(D) Percentages of active-Caspase3+ cells within each of the four consecutive GC B cell populations.
Each symbol (C: eYFP n = 6, MIZ1KO n = 6; D: eYFP n = 4, MIZ1KO n = 4) represents an individual mouse; small horizontal lines show mean and SEM. Data in (C, D) is representative from two experiments. *, P ≤ 0.05; **, P ≤ 0.01; ***, P ≤ 0.001; ****, P ≤ 0.0001; Two-way ANOVA in (C, D)). ns, not significant.

