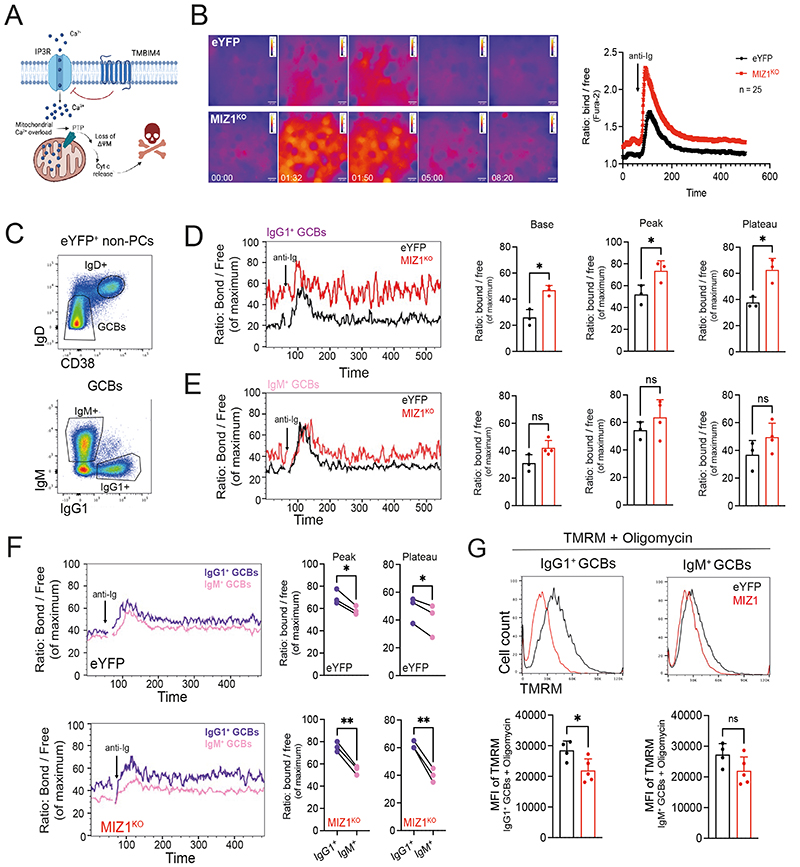
Figure 5. Miz1 limits Ca2+ release in IgG1+ GC B cells through Tmbim4.
(A) Schematic diagram exemplifying the ER membrane, and TMBIM4 inhibition of Ca2+ release through modulation of IP3R.
(B) Measurement of Ca2+ flux by live cell imaging. Fura-2 stained iGB cells were stimulated with anti-Ig antibody. Ratiometric images were generated by ImageJ. Left: time-point dynamics of Ca2+ flux before (00:00) and after stimulation (01:32, 01:50, 05:00 and 08:20). Right, analysis of ratio: bond / free Ca2+ reflecting cytoplasmic levels. Pooled data from 25 cells for each genotype.
(C) Gating strategy of ex-vivo derived IgM+ and IgG1+ GC B cells subsets, for data presented in (D-E).
(D) Left, representative Ca2+ flux dynamics calcium flux for Indo-1-stained IgG1+; right, graphs of cumulative data for “Base” = cytoplasmatic Ca2+ before stimulation, “Peak” and “Plateau” = cytoplasmatic levels of cytoplasmatic Ca2+ after stimulation. eYFP (control) black line, MIZ1KO red line.
(E) Left, representative Ca2+ flux dynamics calcium flux for Indo-1-stained IgM+; right, graphs of cumulative data as in (D).
(F) Left, representative Ca2+ flux between IgG1+ (purple line) and IgM+ (pink line) GC B cells in each individual mouse of the same genotype. Right, “Peak” and “Plateau” = cytoplasmatic levels of cytoplasmatic Ca2+ after stimulation. Top, eYFP (control); bottom MIZ1KO.
(G) Measurement of ΔΨM using TMRM dye. Top, representative TMRM levels from IgG1+ and IgM+ GC B cells derived ex-vivo from eYFP (control, black line) and MIZ1KO (red line). Bottom, graphs displaying cumulative data analysis. MFI of TMRM is shown.
Each symbol (D-F: eYFP n = 3, MIZ1KO n = 3; G: eYFP n = 5, MIZ1KO n = 5) represents an individual mouse; small horizontal lines show mean and SEM. Data in (B) is representative of four experiments. Data in (D-F) is representative of three experiments. Data in (G) is representative of two experiments. *, P ≤ 0.05; **, P ≤ 0.01 (unpaired two-tailed Student’s t test in (D, E, G); paired t test in (F)). ns, not significant.

