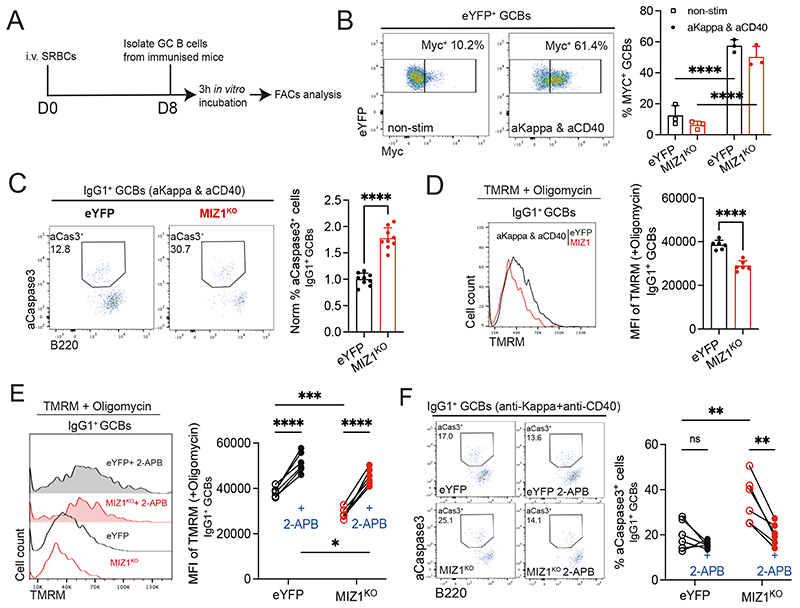
Fig. 6. IP3R inhibition protects Miz1KO IgG1+ GC B cells from apoptosis.
(A) Schematics of the experimental workflow.
(B) Left, Representative plots for the percentage of Myc+ GC B cells after 3 hours in culture under non-stimulation condition (non-stim) and upon F(ab’)2 anti-Kappa and anti-CD40 antibody stimulation (aKappa & aCD40). Right, graph displaying representative data for eYFP (control, black line) and MIZ1KO (red line).
(C) Measurement of apoptosis by active-Casepase3+ stain. Left, representative gating strategy for active-Casepase3+ (aCaspase3) cells by intracellular stain of IgG1+ GC B cells upon 3-hour stimulation with F(ab’)2 anti-Kappa and anti-CD40 antibody (aKappa & aCD40). Right, graph displaying cumulative data of normalized percentages of active-Casepase3+ IgG1+ GC B cells. eYFP (control, black line) and MIZ1KO (red line).
(D) Measurement of ΔΨM using TMRM dye. Left, representative TMRM levels from IgG1+ GC B cells derived from in vitro cultures as in (C). Right, graph displaying cumulative data analysis. MFI of TMRM is shown.
(E) Impact of IP3R inhibitor 2-APB on ΔΨM. Left, representative TMRM levels from IgG1+ GC B cells derived from in vitro cultures as in (C) treated (filled plots) or not (single line) with 2-APB. Right, graph displaying cumulative data paired analysis. MFI of TMRM is shown.
(F) Impact of IP3R inhibitor 2-APB on apoptosis. Left, representative gating strategy for active-Casepase3+ (aCaspase3) in IgG1+ GC B cells from in vitro cultures as in (C) treated (filled plots) or not (single line) with 2-APB. Right, graph displaying cumulative data of percentages of active-Casepase3+ IgG1+ GC B cells.
Each symbol (B: eYFP n = 3, MIZ1KO n = 3; C: eYFP n = 9, MIZ1KO n = 9; D-E: eYFP n = 6, MIZ1KO n = 6; F: eYFP n = 6, MIZ1KO n = 6) represents an individual mouse; small horizontal lines show mean and SEM in (C, E). Data in (B) is representative of three experiments. Data in (C) is from three independent experiments. Data in (D-E) is representative of two experiments. Data in (F) is from two independent experiments. *, P ≤ 0.05; **, P ≤ 0.01; ***, P ≤ 0.001; ****, P ≤ 0.0001 (unpaired two-tailed Student’s t test (C, D), Two-way ANOVA (B, E, F)).

