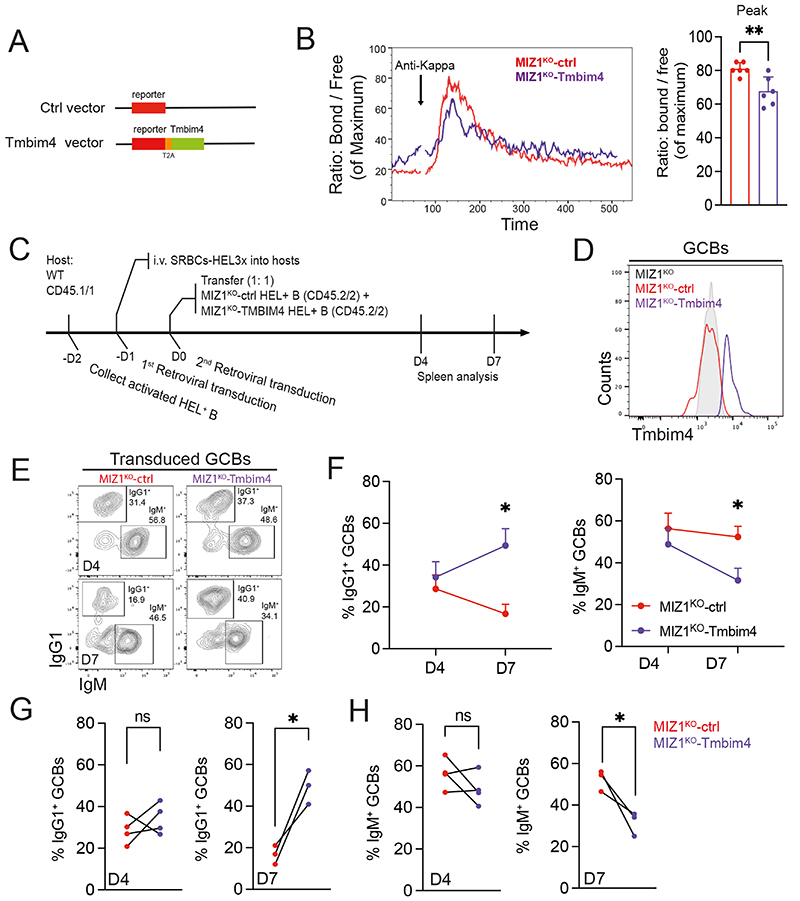
Fig. 7. Tmbim4 restoration rescues IgG1+ GC B cell positive selection.
(A) Schematic design of the retroviral vectors for Tmbim4 restoration and control.
(B) Left, representative Ca2+ flux dynamics for Indo-1 stained iGB cells upon restoration (Miz1KO-Tmbim4) or not (Miz1KO-ctrl) of Tmbim4 in MIZ1KO cells. Right, cumulative data for Ca2+ flux shown as “Peak” = highest cytoplasmatic levels after stimulation.
(C) Schematics of the experimental workflow for the restoration of Tmbim4 levels in vivo.
(D) Representative plots of ex vivo GC B cells displaying restoration (Miz1KO-Tmbim4) or not (Miz1KO-ctrl) of Tmbim4.
(E) Gating strategy for IgG1+ and IgM+ GC B cell subsets generated from donor-derived reporter positive B cells.
(F) Dynamic changes of the percentages of IgG1+ and IgM+ B cell subsets in retrovirally transduced GC B cell on day 4 and day 7.
(G) Cumulative data for IgG1+ B cell percentages within GC B cells upon restoration (Miz1KO-Tmbim4) or not (Miz1KO-ctrl) of Tmbim4 in MIZ1KO cells. Left, day 4 after cell transfer; right, day 7 after cell transfer.
(H) Cumulative data for IgG1+ B cell percentages within GC B cells upon restoration (Miz1KO-Tmbim4) or not (Miz1KO-ctrl) of Tmbim4 in MIZ1KO cells. Left, day 4 after cell transfer; right, day 7 after cell transfer.
Each symbol (B: MIZ1KO-ctrl n = 6, MIZ1KO-Tmbim4 n = 6; E-H: day 4 n = 4; day 7 n = 3) represents an individual mouse. Data in (B) is from two independent experiments, data in (E - F) is one representative from two independent experiments. *, P ≤ 0.05; **, P ≤ 0.01 (unpaired two-tailed Student’s t test in (B); paired multiple t test (F); paired t test (G-H)).

