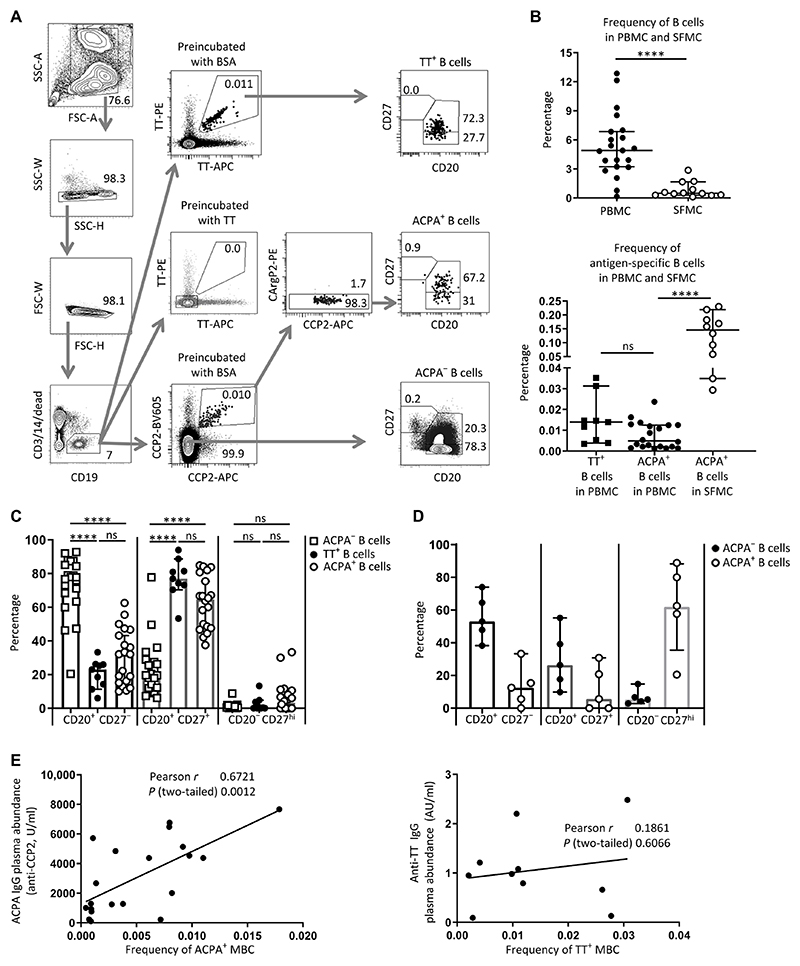
Fig. 1. Identification and subset characterization of ACPA-positive and tetanus toxoid–specific B cells in RA.
(A) Gating strategy. Peripheral blood mononuclear cells (PBMCs) from single donors (patients with RA, n = 21) were divided into three fractions and stained with either CCP2 and CArgP2 streptavidin tetramers to identify ACPA+ B cells or with directly labeled tetanus toxoid (TT) to identify TT+ B cells. Preincubation with unlabeled TT or bovine serum albumin (BSA) was used to demonstrate specificity of the TT staining. Subsets of B cells were delineated by the presence of CD20 and CD27. SSC, side scatter; FSC, forward scatter. (B) Top: Frequency of CD19+ B cells in PBMC and synovial fluid mononuclear cells (SFMCs). Bottom: Frequency of TT+ B cells and ACPA+ B cells in PBMCs versus ACPA+ B cells in SFMCs. (C) Subset distribution of ACPA-negative (ACPA−), TT+, and ACPA+ B cells in PBMCs based on CD20 and CD27 abundance (n = 21). ns, not significant. (D) Subset distribution of ACPA+ and ACPA− B cells in SFMCs (n = 5). (E) Correlation between the frequency of ACPA+ memory B cells (MBCs) (defined as CD20+CD27+) in PBMC and plasma ACPA IgG concentrations (left, n = 20) and correlation between the frequency of TT+CD20+CD27+ B cells and plasma anti-TT IgG antibodies (right, n = 10). The correlation between ACPA+ MBCs and plasma ACPA IgG remains upon removal of the data point with the highest ACPA plasma concentration (r = 0.57; P = 0.01). In (B) to (E), each dot represents one patient sample. ****P ≤ 0.0001. Two-tailed Mann-Whitney test in upper panel of (B), one-way ANOVA with Dunn’s multiple comparison test in lower panel of (B) and in (C) and (D); Pearson correlation in (E). All data represent median ± 95% confidence interval; n = number of donors. AU, arbitrary units.

