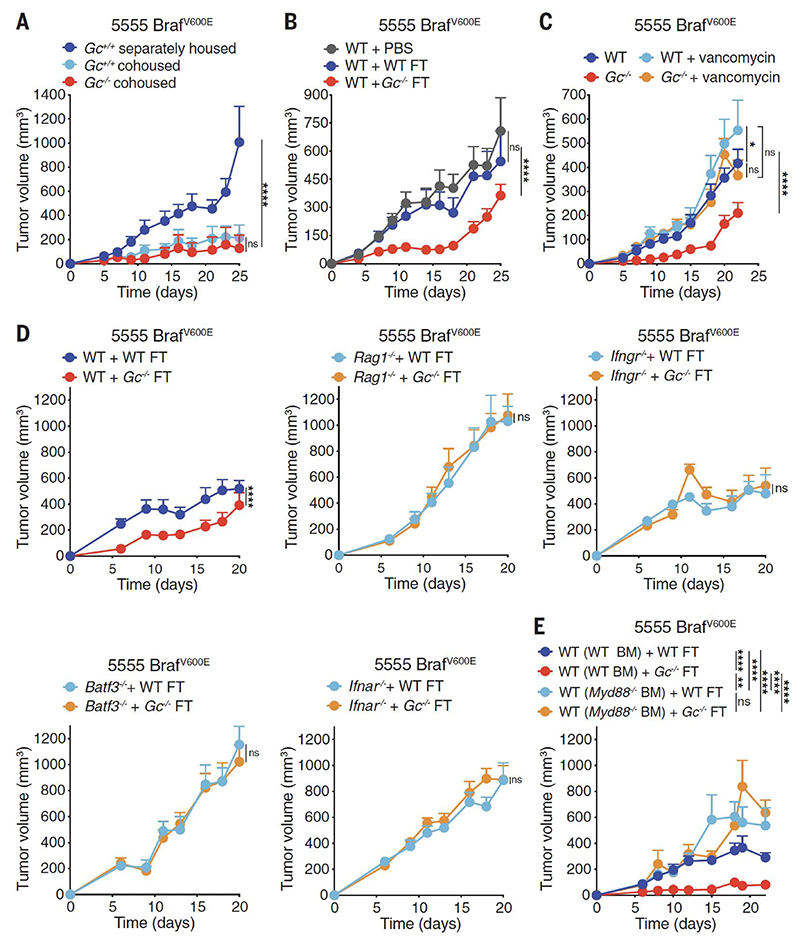
Fig. 2. Fecal transplants from Gc-/- mice increase anti-cancer immunity.
(A-E) Growth profile of 0.2 x 10⁶ 5555 BrafV600E cancer cells implanted into: (A) Separately housed Gc+/+ (n=12) and co-housed Gc+/+ (n=7) and Gc-/- (n=6) groups of mice. (B) Separately housed groups of WT C57BL/6J mice (n=10 per group) that received orally PBS or fecal transplant (FT) from WT or Gc-/- donors twice (days -14 and - 12) before tumor inoculation (day 0). (C) Separately housed groups of WT C57BL/6J or Gc-/- mice that received or not vancomycin (0.5 g/L) in the drinking water starting from 2 weeks prior to tumor inoculation. WT (n=11), WT + vancomycin (n=10), Gc-/- (n=11), Gc-/- + vancomycin (n=10). (D-E) the indicated separately housed groups of mice that received oral FT from WT C57BL/6J or Gc-/- donors twice (days -14 and -12) prior to tumor inoculation (day 0). (D) WT (n=11 per group), Rag1-/- (n=9 per group), Ifngr1-/- (n=10 per group), Batf3-/- (n=10) and Ifnar-/- (n=10 per group) mice, (E) Irradiated CD45.1 WT mice reconstituted using bone marrow (BM) from CD45.2 WT or Myd88-/- donors. WT (WT BM) + WT FT (n=11), WT (WT BM) + Gc-/- FT (n=12), WT (Myd88-/- BM) + WT FT (n=10), WT (Myd88-/- BM) Gc-/- FT (n=10). Data in (A-E) are presented as tumor volume (mm3) ± SEM and are representative of two independent experiments. Tumor growth profiles (A-E) were compared using Bonferroni-corrected two-way ANOVA. *p<0.05, **p<0.01, ***p< 0.001, ****p< 0.0001; ns, not significant.

