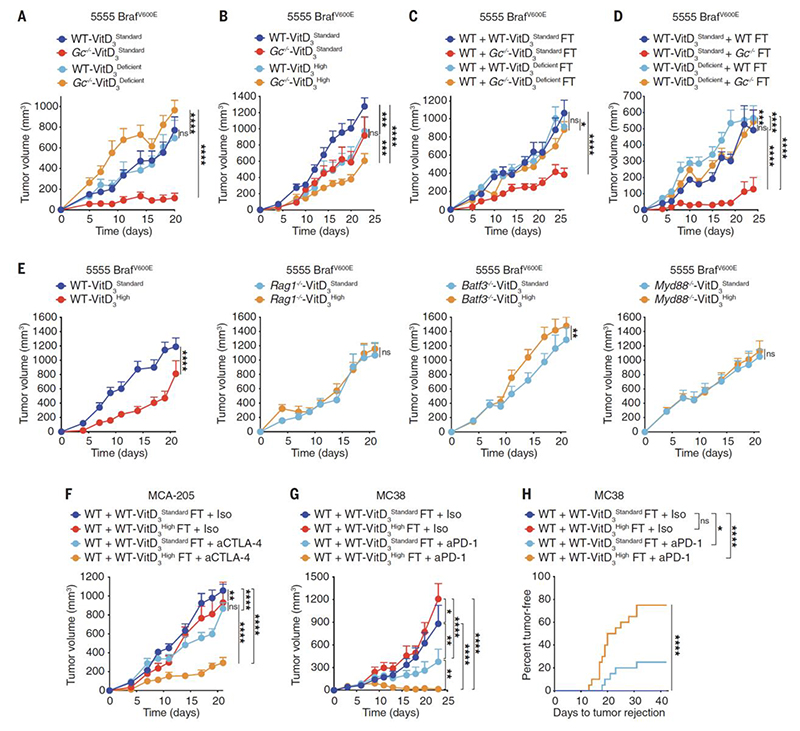
Fig. 3. Loss of Gc increases VitD-dependent anti-cancer immunity by altering the gut microbiome.
(A-E) Growth profile of 0.2 x 10⁶ 5555 BrafV600E cancer cells implanted into: (A-B) WT C57BL/6J or Gc-/- mice that were fed a VitD3 standard (2 IU/g), deficient (0 IU/g) or high (10 IU/g) diet starting from 3.5 weeks before tumor inoculation. (A) WT + VitD3Standard (n=8), WT + VitD3Deficient (n=9), Gc-/- + VitD3Standard (n=8), Gc-/- + VitD3Deficient (n=9). (B) WT + VitD3Standard (n=12), WT + VitD3High (n=13), Gc-/- + VitD3Standard (n=12), Gc-/- + VitD3High (n=13). (C) WT C57BL/6J (n=10 per group) that received (on days -14 and -12 prior to tumor inoculation) FT from WT C57BL/6J or Gc-/- donors that had been fed with VitD3 standard or deficient diet. (D) WT C57BL/6J mice that were fed a VitD3 standard or deficient diet starting 3.5 weeks before FT (on days -14 and -12 prior to tumor inoculation) with fecal matter from WT C57BL/6J or Gc-/- donors. WT-VitD3Standard + WT FT (n=7), WT-VitD3Standard + WT Gc-/- (n=10), WT-VitD3Deficient + WT FT (n=10), WT-VitD3Deficient + WT Gc-/- FT (n=10). (E) WT C57BL/6J, Rag1-/-, Batf3-/- or Myd88-/- mice (n=10 per group) that were fed with VitD3 standard or high diet starting from 3.5 weeks before tumor inoculation. (F) Growth profile of 0.5 x 10⁶ MCA-205 cancer cells implanted into WT C57BL/6J mice (n=10 per group) that received (on days -14 and -12 prior tumor inoculation) FT from WT C57BL/6J donors that were fed with VitD3 standard or high diet. Mice were treated i.p. with 50μg of isotype-matched control or anti-CTLA-4 antibody on days 6, 9 and 12. (G-H) Separately housed groups of WT C57BL/6J mice implanted with 0.5 x 10⁶ MC38 that received (on days -14 and -12 prior to tumor inoculation) FT from WT C57BL/6J donors that were fed with VitD3 standard or high diet. Mice were treated i.p. with 200μg of isotype-matched control or anti-PD-1 monoclonal antibody every 3 days from day 3 to day 12. (G) Growth profile (n=10 mice per group). (H) Percent tumor rejection from two independent experiments (n=20 mice per group). Data in (A-G) are presented as tumor volume (mm3) ± SEM and are representative of two independent experiments. Tumor growth profiles (A-G) were compared using Bonferroni-corrected two-way ANOVA. Incidence of tumor rejection in (H) were compared using Log-rank (Mantel-Cox) test for comparison of each group with WT C57BL/6J + isotype and Log-rank for trend for comparison of all groups. *p<0.05, **p<0.01, ***p< 0.001, ****p< 0.0001; ns, not significant.

