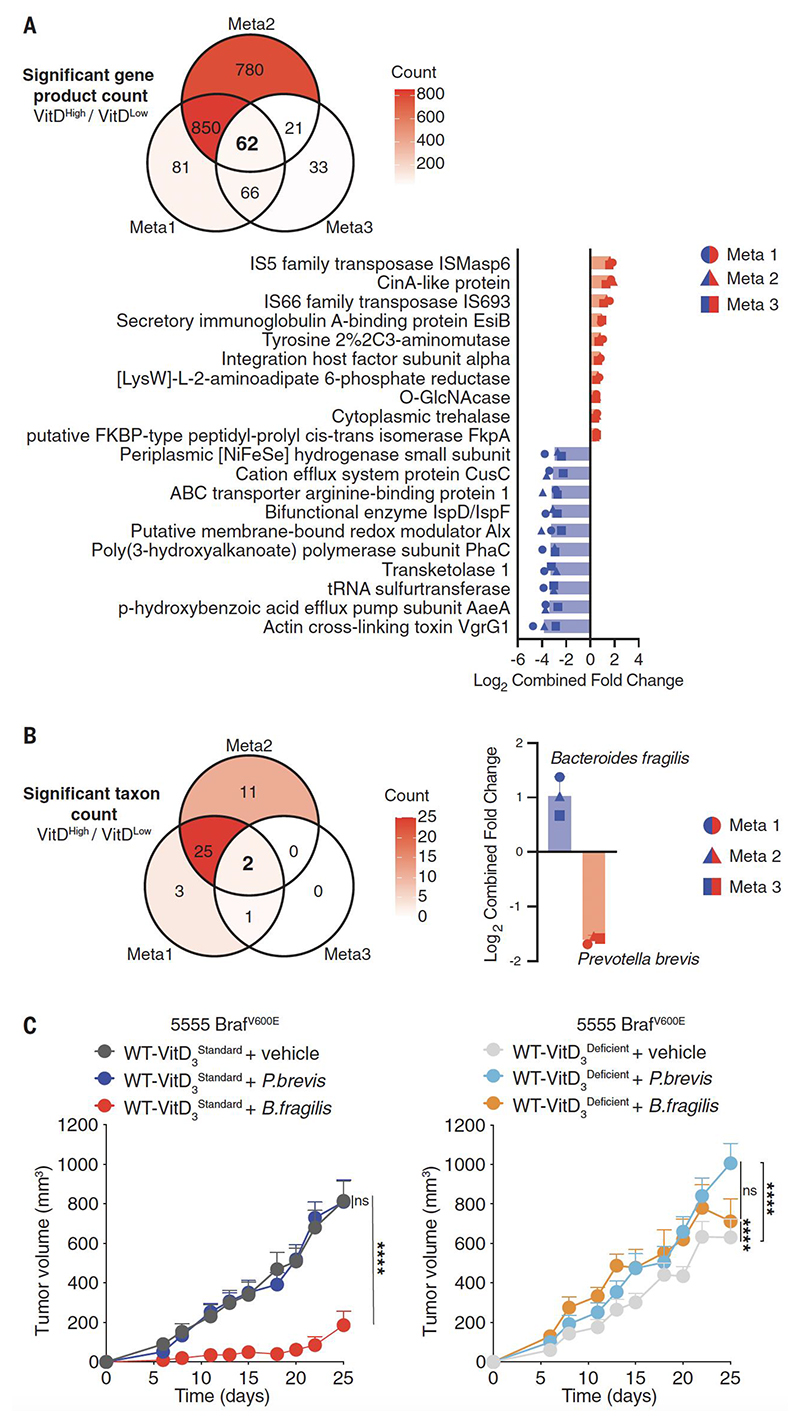
Fig. 5. B.fragilis promotes tumor resistance in a VitD-dependent manner.
(A-B) Meta-analysis of metagenomic data to determine (A) common features in microbial gene products (top 20/62 features in each direction shown, 20/62) and (B) last known taxon associated with differences in VitD availability. Fecal samples were sequenced from WT or Gc-/- mice that had been fed with VitD3 standard (2 IU/g), deficient (0 IU/g) or high (10 IU/g) diet for 3.5 weeks. Comparison is of mice with high VitD availability [WT + VitD3High (n=13), Gc-/- + VitD3Standard (n=20), Gc-/- + VitD3High (n=13) vs. mice with normal or low VitD availability [WT + VitD3Standard (n=22), WT + VitD3Deficient (n=10), Gc-/- + VitD3Deficient (n=10)]. In (A, B), count of significant features indicated in the Venn diagram and shown by color scale (top) and ranked bar plots (bottom) show common features across 3 meta-analyses as indicated. (C) Growth profile of 0.2 x 10⁶ 5555 BrafV600E cancer cells implanted into separately housed WT C57BL/6 groups of mice (n=10 per group) fed with VitD3 standard (left graph) or deficient diet (right graph), starting 3.5 weeks before receiving B. fragilis, P. brevis or vehicle. Mice received 109 B. fragilis or P. brevis by oral gavage on days -14, -12 and -10 prior to tumor inoculation. Data in (A, B) are presented as average log2 median fold change from three meta-analyses of data from two independent experiments. Data in (C) are presented as tumor volume (mm3) ± SEM and are representative of two independent experiments for P. brevis and 3 independent experiments for B. fragilis. In (A, B), p values were calculated using the Mann–Whitney–Wilcoxon U test on parts per million (PPM) relative abundances for that feature in samples within each group for pairwise comparisons. The combined p value (cp) for meta-analysis of within-group comparisons was calculated using Fishers P value. For each feature type, the cut-offs for the meta-analysis were: p< 0.2, cp< 0.1, false discovery rate (FDR)<0.15. Tumor growth profiles (A, C and D) were compared using Bonferroni-corrected two-way ANOVA. ****p< 0.0001; ns, not significant.

