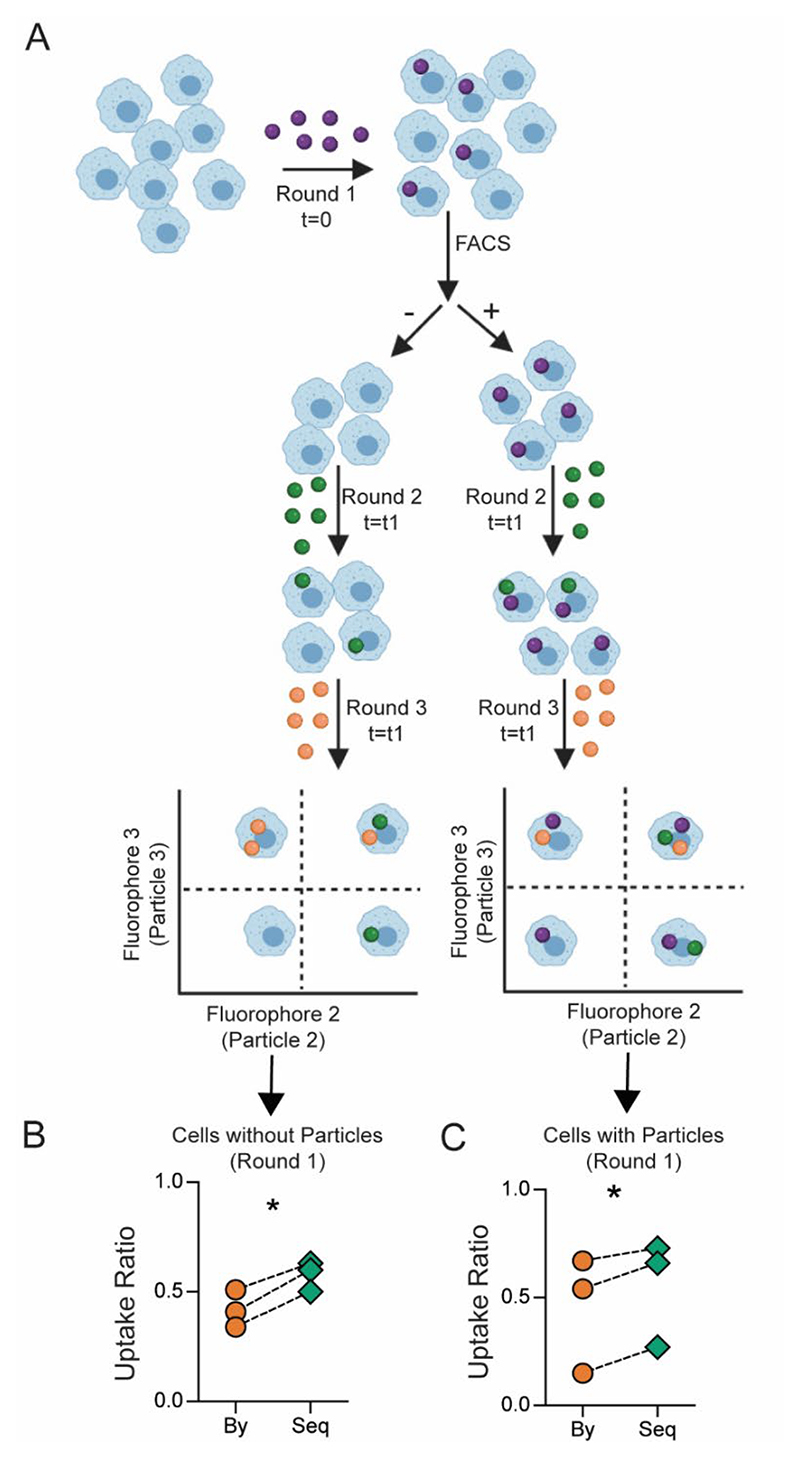
Figure 4. Cellular heterogeneity does not explain sequential uptake in its entirety.
A − Schematic describing the experimental design of sorting and uptake study. B and C − Measurement of bystander (By) and sequential (Seq) phagocytosis by cells that did not take up particles prior to sorting (B) and those that did take particles prior to sorting (C). Following particle types and cell to particle ratio were used: round 1, 500 nm-carboxylated polystyrene (PS-COOH), 1:10; round 2, BSA-TRITC adsorbed 3 μm PS-COOH, 1:5; round 3, 2900 nm PS-COOH, 1:2. FACS stands for fluorescence-activated cell sorting. Data are based on n = 3 independent experiments (each performed in duplicate). * indicates p < 0.05 determined using paired Student’s t-test.

