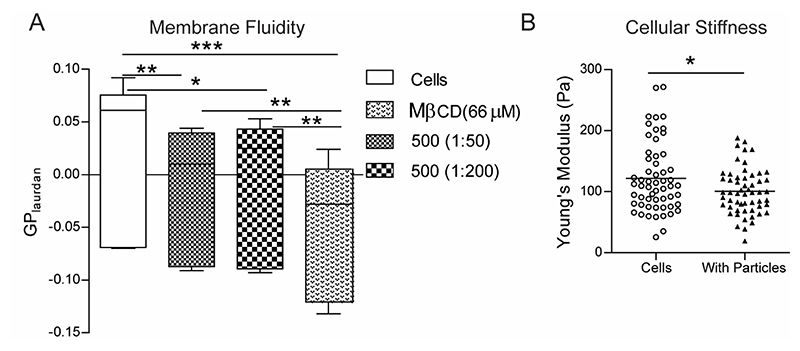
Figure 5. Phagocytosis induced changes in macrophage membrane fluidity and cellular stiffness.
A − Measurement of membrane fluidity using the generalized polarization (GP) value for the membrane dye Laurdan in RAW macrophages that were incubated with 500 nm-carboxylated polystyrene (PS) particles at two different cell-to-particle ratios and compared to the negative control of naïve cells (cells) as well as the positive control of cells treated with methyl-beta-cyclodextrin (MβCD). n = 6 independent experiments. * indicates p < 0.05, ** indicates p < 0.01 ** and *** indicates p < 0.001 calculated using one-way ANOVA followed by Bonferroni post-hoc test for comparison of multiple groups. B − Measurement of apparent modulus of a cell using atomic force microscopy. Young’s modulus of naïve cells (Cells) and cells that have been treated with 500 nm-carboxylated PS particles (With Particles) is plotted, with each dot representing a single cell. Data sets are representative of at least 60 cells measured across 3 independent experiments. * indicates p < 0.05 calculated using unpaired t-test with Welch’s correction.

