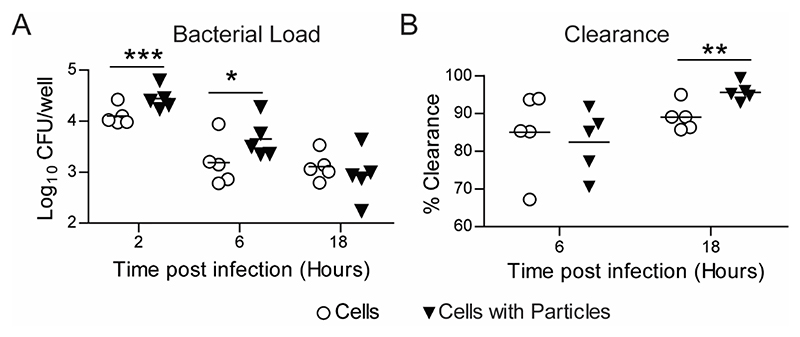
Figure 6. E. coli Clearance - in vitro.
A − Measurement of E. coli numbers inside RAW macrophages at different times following exposure of cells to bacteria. Cells were previously treated with 500 nm-carboxylated polystyrene particles for 18 hours (Cells with Particles), and naïve cells (Cells) were used as controls. Enumeration of intracellular bacteria as colony forming units (CFU) obtained by plating cell lysate at specified time points. B − Change in bacterial load measured over time as percentage intracellular bacteria killed by time ‘t’ compared to 2-hour time-point. Data sets are representative of n = 5 independent experiments. * = p < 0.05, ** = p < 0.01 and *** = p < 0.001 calculated using Student’s t-test.

