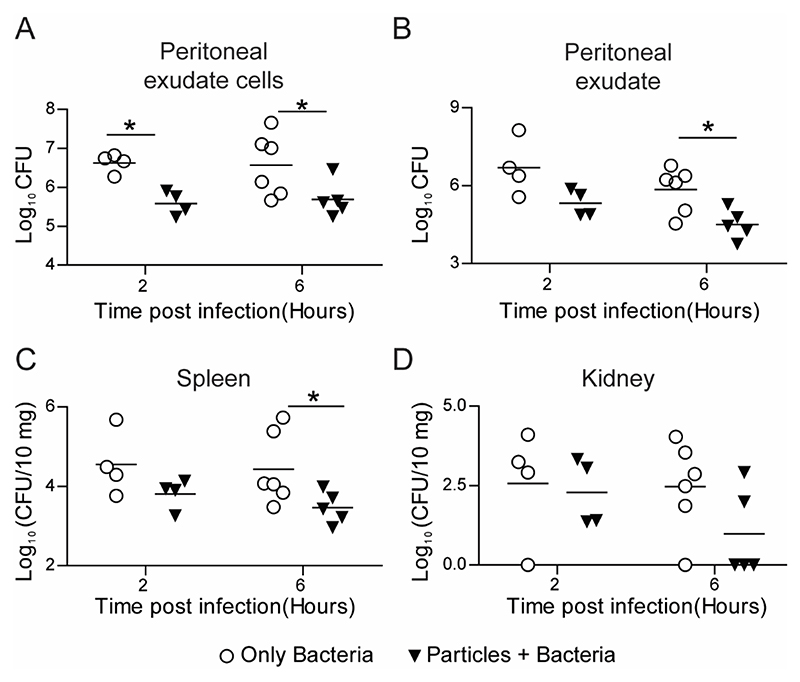
Figure 7. E. coli Clearance - in vivo.
Kinetics of clearance of E. coli from C57BL6 mice following intraperitoneal injection of 1010 500 nm-carboxylated PS particles (or saline), and subsequent injection (2 hours later) of 5 × 10⁷ bacteria per mouse. Bacterial load measured as CFU from lysates of A − peritoneal exudate cells, B − peritoneal exudate, C − spleen and D − kidney are plotted against time post bacterial injection (organ CFU plotted as per 10 mg of organ weight). Each point on the plot corresponds to one mouse. Mann-Whitney test was performed for statistical comparison. * indicates p ≤ 0.5.

