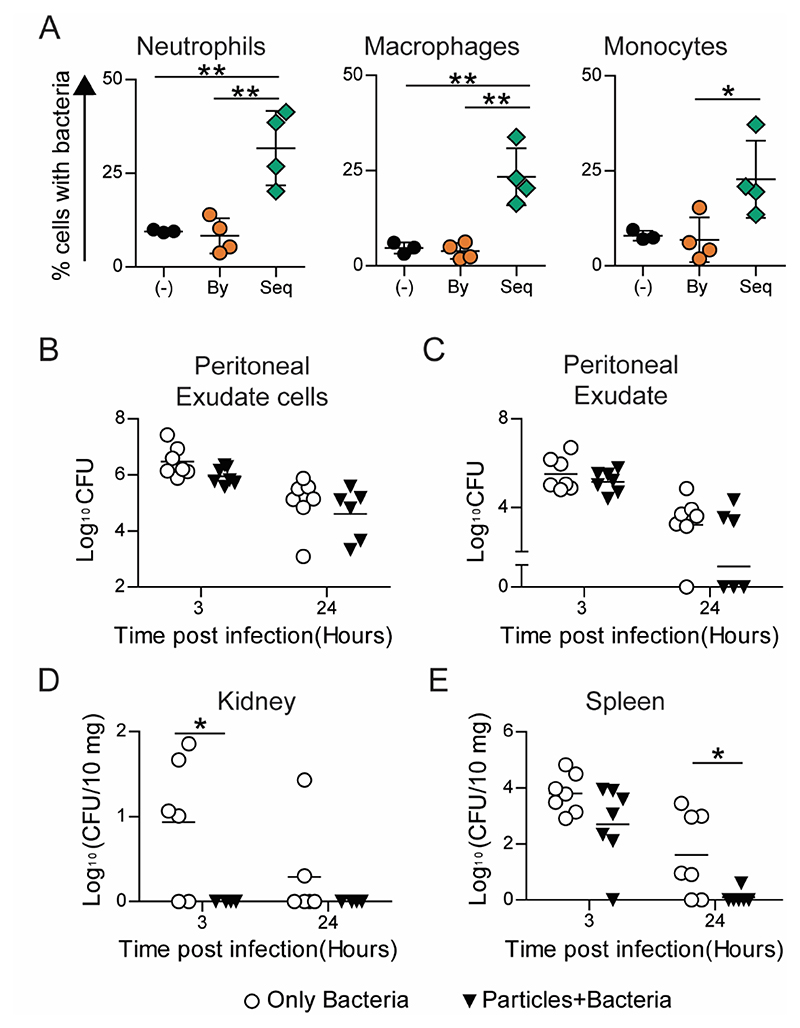
Figure 8. S. epidermidis Clearance.
A − Uptake of fluorescent 500 nm-carboxylated polystyrene (PS) particles and GFP-expressing S. epidermidis following their in vivo intraperitoneal administration (in C57BL6) in a sequential manner. (-) indicates mouse injected with saline followed by bacteria, “By” indicates bystander cells and “Seq” indicates sequential uptake cells in mice injected with particles followed by bacteria. B-E − Kinetics of bacterial clearance determined in C57BL6 mice following intraperitoneal injection of 109 500nm-carboxylated PS particles or saline, and subsequent injection of ~3 × 10⁸ S. epidermidis. Bacterial load measured as colony forming units (CFU) from lysates of B − peritoneal exudate cells, C − peritoneal exudate, D − kidney and E − spleen (plotted as CFU per 10 mg of organ weight) are plotted against time post infection. Each data point corresponds to one mouse. Mann Whitney test was performed for statistical comparison. * indicates p ≤ 0.5.

