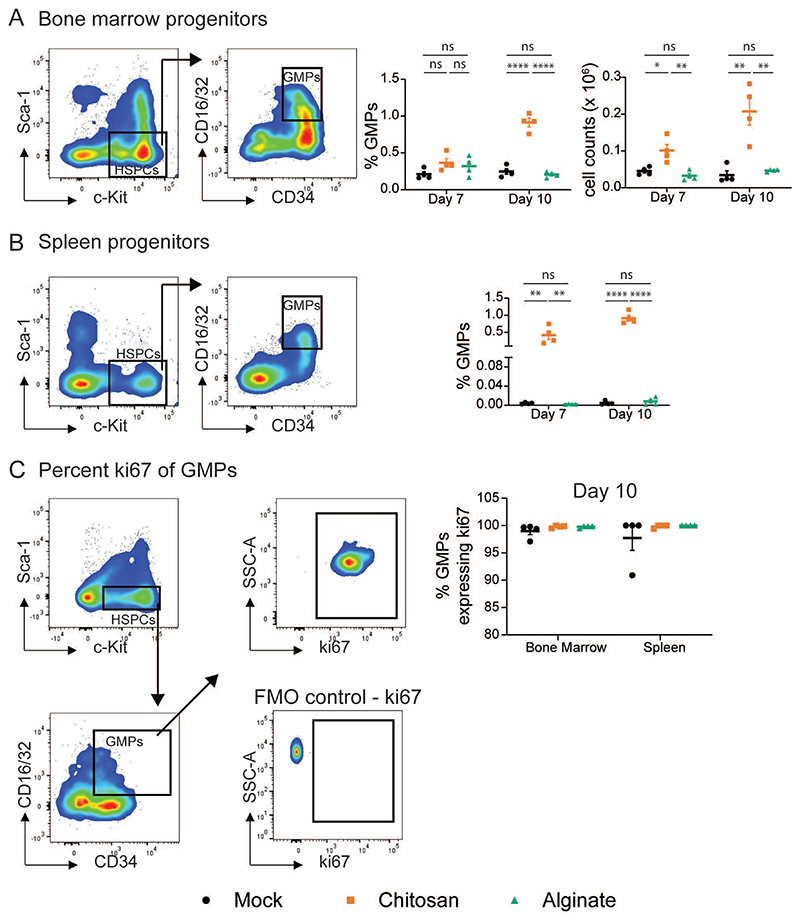
Figure 2. Quantifying Granulocyte-Monocyte Progenitors (GMP).
A and B – Representative flow cytometry dot plots to determine GMPs (c-Kit+ Sca1- CD34+ CD16/32+) and quantification of granulocyte-monocyte progenitors (GMPs) as a percentage of total live single cells from bone marrow (BM) (A) and spleen (B) at day 7 and 10 after mock or microsphere-implantation. Absolute GMP counts in the bone marrow were obtained by multiplying GMP percentage with total cell counts. c-Kit+ Sca-1- population was identified as a sub-population of live cells and lineage negative (Lin–) cells, where Lin– indicates negative for I-A/I-E, CD49b, NK-1.1, CD11c, Ly6C, Ly6G, CD3, CD127, CD19 and CD45R/B220. C - Representative flow cytometry dot plots to determine ki67 expressing GMPs. Fluorescence-minus-one (FMO) plot was used to ascertain ki67 gate position. Percentage of GMPs expressing ki67 was quantified from the BM and spleen of mice at day 10 after mock or microsphere-implantation. For statistical analyses, a one-way ANOVA was performed followed by Tukey post-test, and * = p < 0.05; ** = p < 0.01; *** = p < 0.001; and **** = p < 0.0001.

