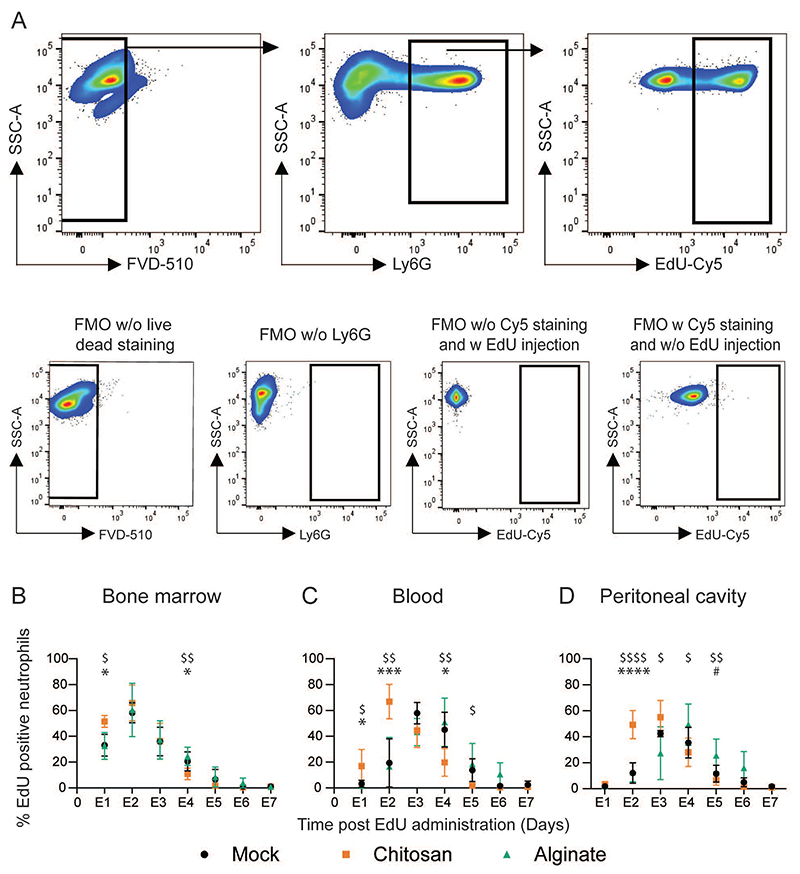
Figure 5. Tracking labelled neutrophils.
A - Gating strategy used to determine labelled (EdU positive) neutrophils. Fluorescence-minus-one (FMO) plots were used to ascertain gate positions. Plots are representative of multiple independent experiments. B – D – Labelled neutrophil percentages in the bone marrow (B) blood (C) and the peritoneal cavity (D) at different times. N = 3-7 mice/time point/per group pooled from at least 3 independent experiments including both male and female mice (no difference was observed based on sex of mice). For statistical analyses, at each time point, a one-way ANOVA was performed followed by Tukey post-test. *, $ and # indicates comparison between mock vs chitosan, alginate vs chitosan and mock vs alginate, respectively. * = p < 0.05; ** = p < 0.01; *** = p < 0.001; and **** = p < 0.0001

