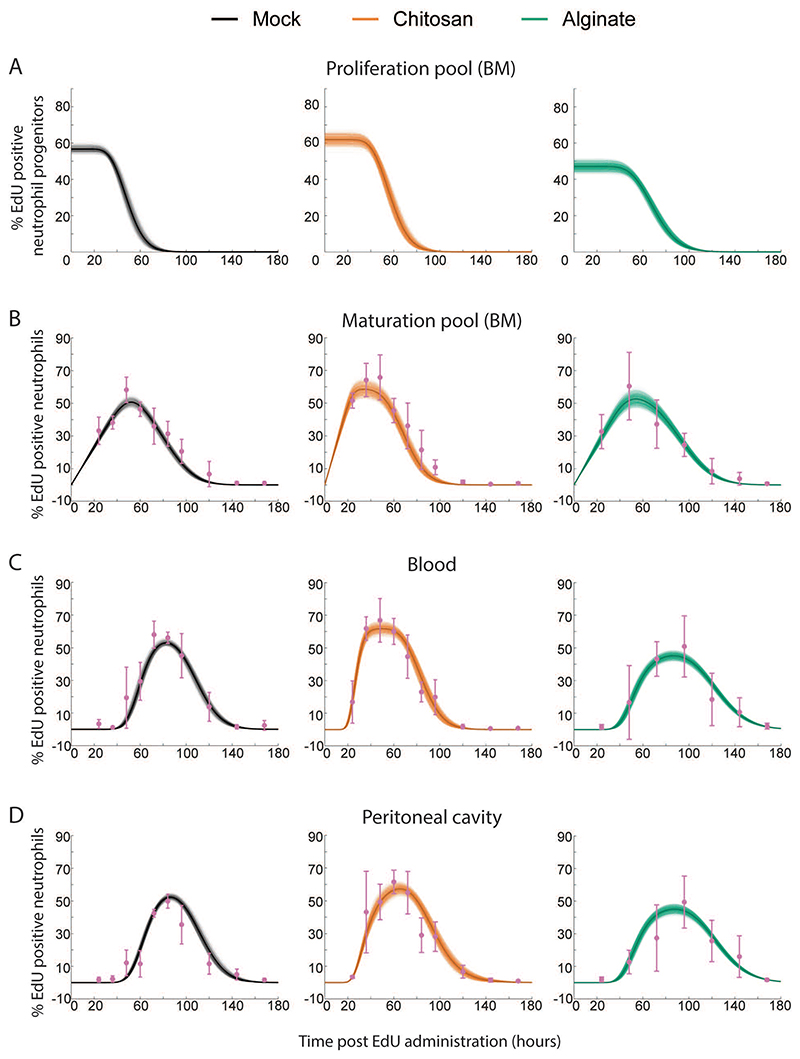
Figure 7. Mathematical Model Fits Obtained using the iABC Procedure.
Representative fits to Mock, Chitosan and Alginate data are shown here. Sample curves corresponding to different parameters sets in proliferation pool (A), maturation pool (B), blood (C) and peritoneal cavity (D) are shown as thin lines and average is shown as thick solid line. Experimentally measured data are shown in pink with standard deviation.

