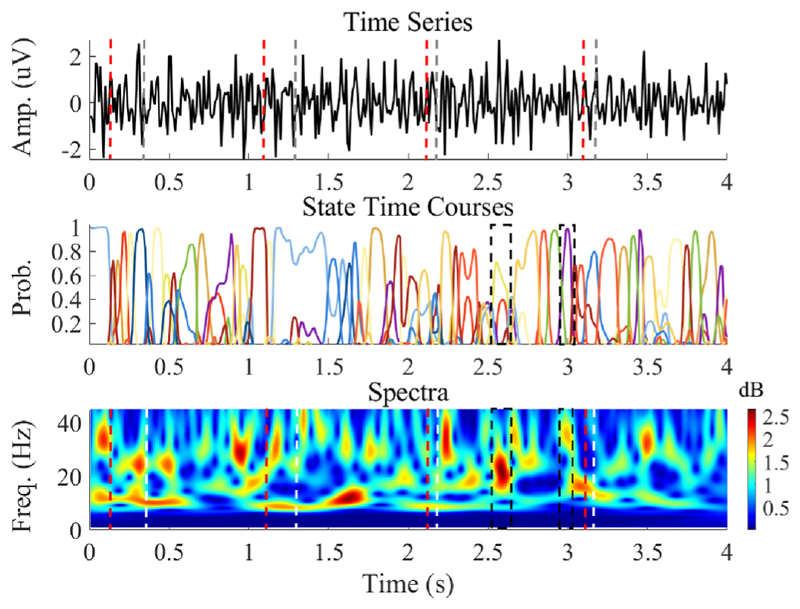
Fig. 4. A 4-s long preprocessed LFP recording (Subject 4) which contains 4 steps.
The top panel is the preprocessed LFP. The red dashed lines represent auditory cues, whilst the grey lines correspond to the stepping movements. The middle panel displays the probability time courses for the HMM states. The bottom panel shows the corresponding time-frequency spectra calculated using the wavelet transform. In this, the red dashed line represents auditory cues, whilst the white dashed line represents stepping movements.

