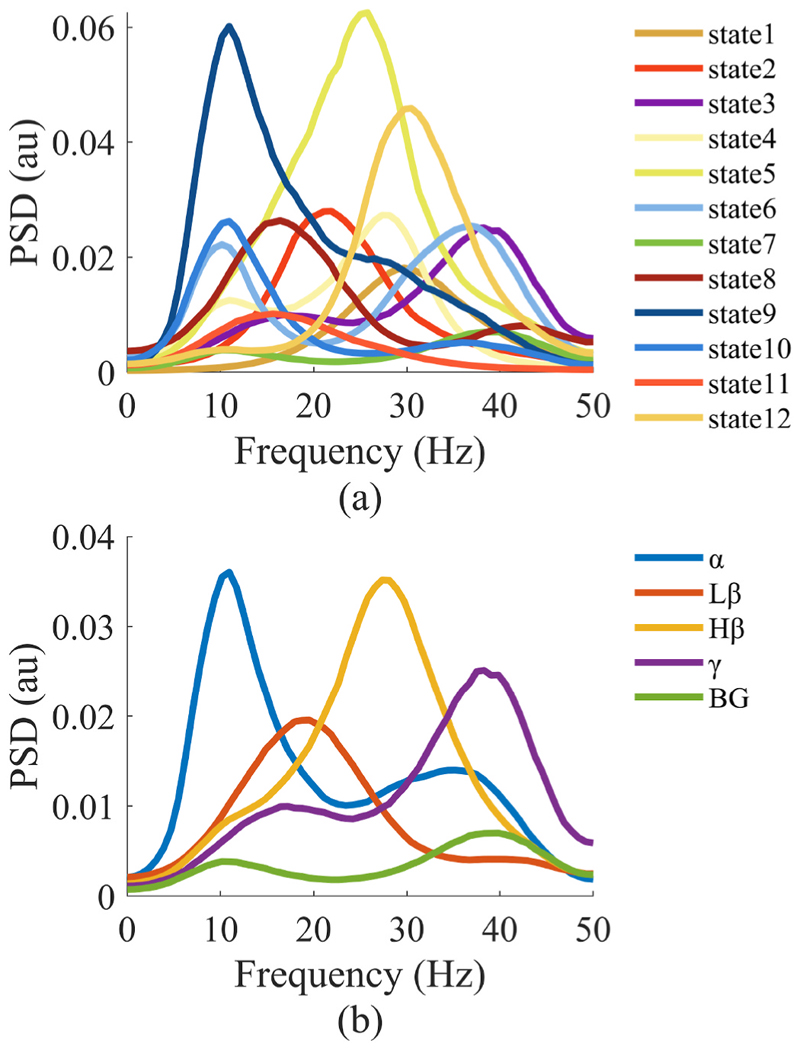
Fig. 6. Assigning HMM states to canonical LFP frequency bands.
Exemplar data are shown from Subject 4. (a) Spectra of HMM states decoded from the preprocessed LFP are shown. (b) Spectra of the HMM states corresponding to each of the five canonical frequency bands are shown. In (a), the states classified to the same frequency band are averaged to obtain (b) (Lβ: low β, Hβ: high β, BG: background activities).

