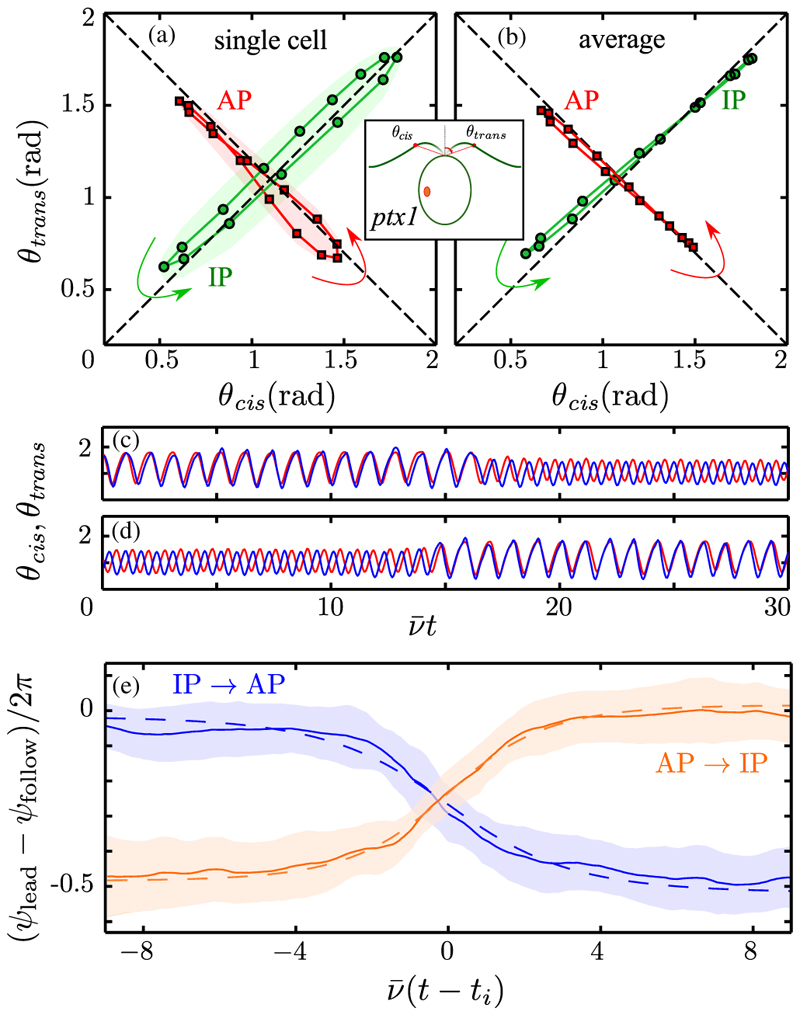
Fig. 3. Synchronization dynamics.
Phase plane of polar angles θ cis,trans reveals the IP (green) and AP (red) synchronization of a single cell (a), and (b) the average over six cells, averaged over 𝒪(103) beats and resampled at 15 points, equally spaced in time. Shaded regions in (a) indicate 1 standard deviation of fluctuations. (c),(d) Sample time series for evolution of θ cis,trans during a transition event. (e) Phase difference dynamics during AP → IP (orange) and IP → AP (blue) transitions for 60 events, with means (solid lines) and standard deviations (shaded), vertically aligned by plotting difference modulo 1. Dashed lines are fits to data.

