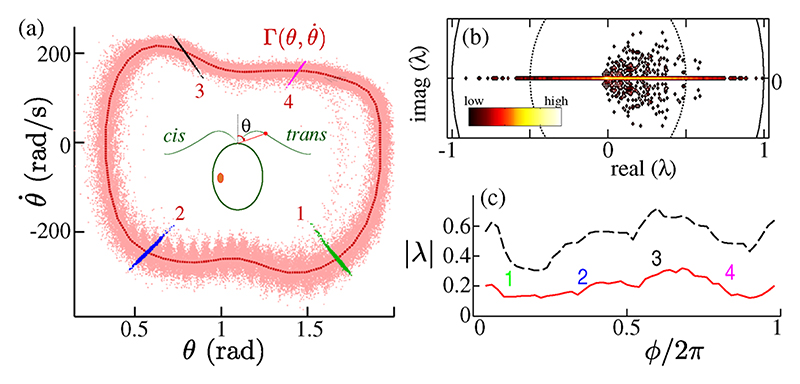
Fig. 1. Noisy flagellar limit cycles.
(a) Trajectories in space at fixed arclength [= (2/7) of the total flagellum length]. Four Poincaré sections are highlighted. For the population (n = 48), (b) shows an accumulated density map of Floquet multipliers {λ} computed at different phases, while in (c) the distribution of |λ| is characterized by its mean (solid line) and 95th percentile (dashed line).

