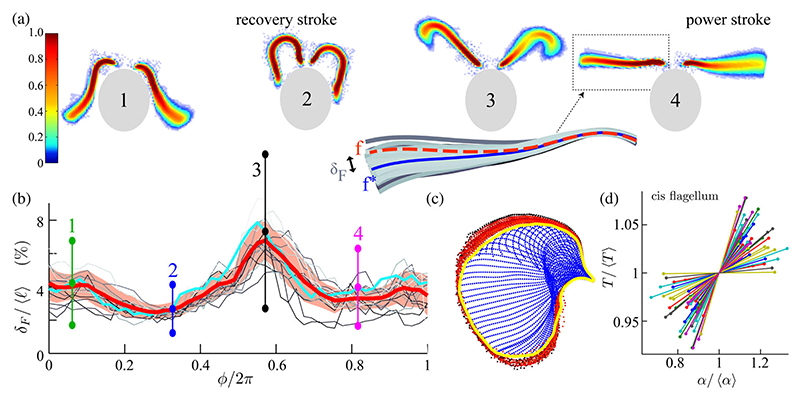
Fig. 2. Noisy flagellar waveforms.
(a) Overlaid waveforms at phases 1–4 [Fig. 1(a)], colored by recurrence. Isophase waveforms f coalesce in a band about an average shape f*. (b) Length-normalized Fréchet distance δF(f, f*) / ℓ computed for multiple cells, showing phase-dependent noise. (Cyan) Average over 𝒪(103) beat cycles for a single cell; error bars: one s.d. from mean. (Red) A multicell average; shading: one s.d. from mean. (c) Discretized points (blue) along a flagellum define an area per beat via an alpha shape (yellow) which fluctuates over successive beat cycles (red). (d) Per-beat area α and per-beat period T are strongly correlated. Individual lines summarize the per-cell noisy scatter.

