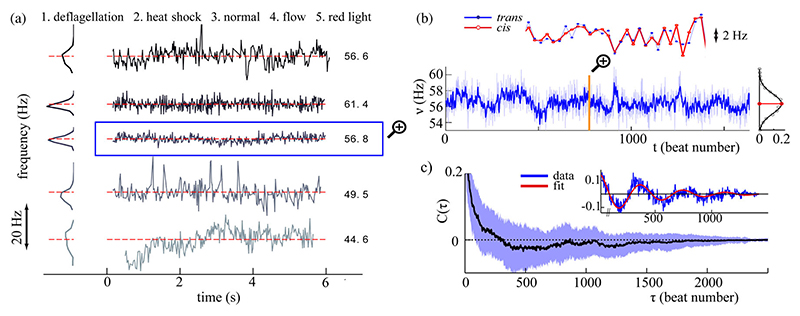
Fig. 3. Correlations in flagellar beating.
(a) Signatures of interbeat frequencies ν(t) in the flagella of cells, observed in a number of scenarios (1–5, see main text). (Time series have been displaced vertically, with mean frequencies as labeled.) (b) Long-range fluctuations in ν(t) are observed. For a control cell (case 3), the filtered signal is superimposed with the raw data, and its probability distribution function fit to a Gaussian function. Cis and trans flagella of the same pair exhibit perfect frequency locking, highlighting the accuracy of the measurement technique. (c) Decay of autocorrelation in interbeat intervals b(t) ≔ 1/ν(t), showing the population average (solid line) and one s.d. from the mean (shaded). (Inset) Parametric fit to a sample C(τ).

