FIG. 2.
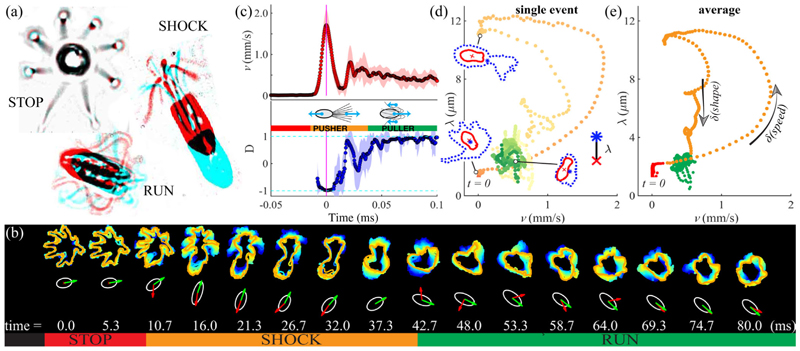
(a) Three gaits of P. octopus: pairs of video frames showing the cell at an initial (red) and a later time (cyan), separated, respectively, by 100, 10, 5 ms for stop, run, shock, are superimposed. (b) Dynamically changing flagellar waveforms produce cell reorientation. Here, traced flagellar envelopes are displayed on coarse (10 ms) and fine (5 ms) timescales. (White ellipses, cell body; green and red arrows, cell orientation êR and swimming direction .) (c) Transition from stop to run occurs via a shock, with rapid changes in speed v and alignment D [“pusher” to “puller” transition, shaded region = 1 standard deviation (std)]. (d), (e) Stop-shock-run sequences are plotted in speed-shape space for a single cell and for a multievent average from different individuals, and they are color coded by time. Sample cell and flagellar boundaries in (d) correspond to instants t = 33, 79, and 211 ms.

