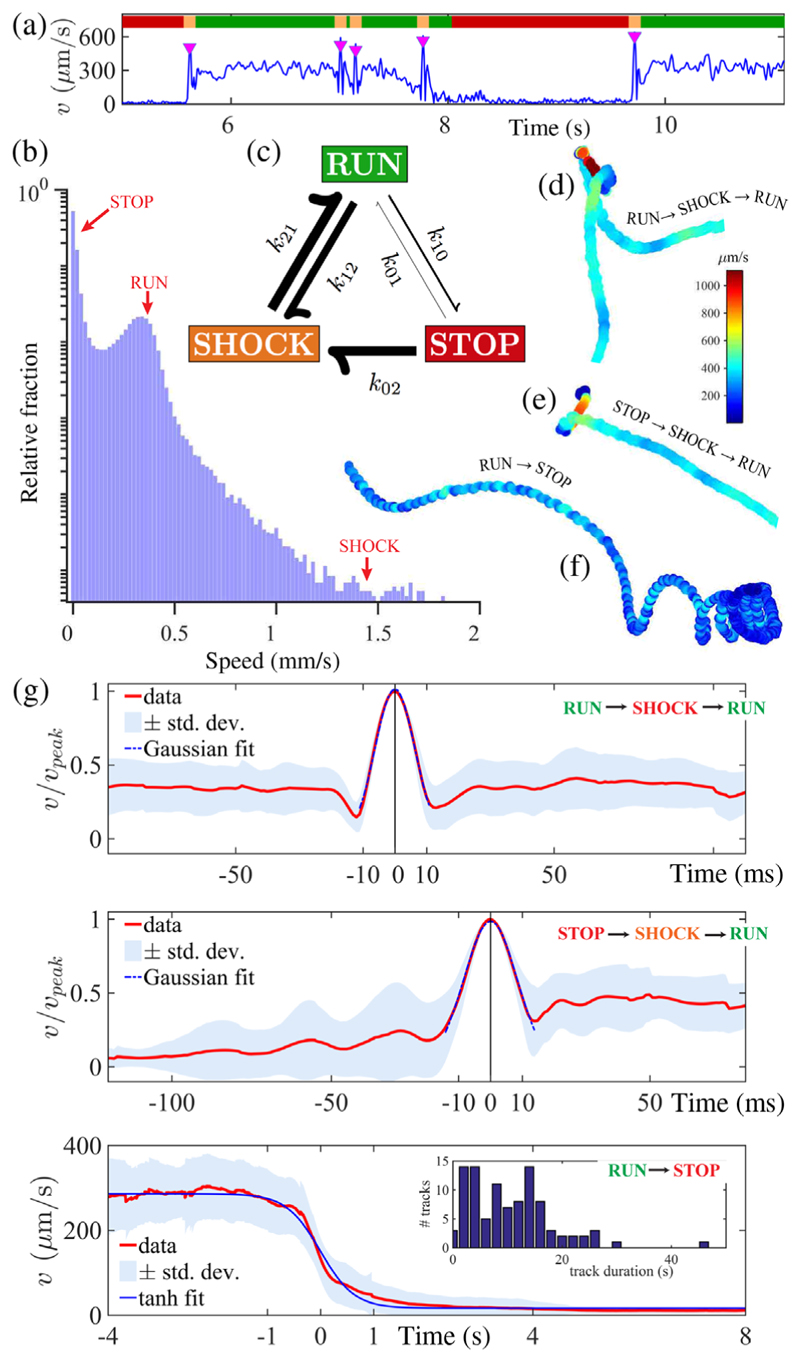
FIG. 3.
(a) Single-cell motility is partitioned by instantaneous speed v(t) into three states (0, stop; 1, run; 2, shock). Shocks are denoted by downward triangles. (b) Probability density distribution of speeds (log scale) reveal dwell times in each state. (c) Permissible gait transitions are indicated by arrows (weighted by rates kij). (d)–(f) Sample trajectories for characteristic transition sequences. (g) Superimposed and averaged swimming speeds exhibit pulselike maxima during shocks, but much slower decay during run⇀stop transitions. (Inset) Histogram of track durations.

